4-Point Editable Money Bundle Infographic
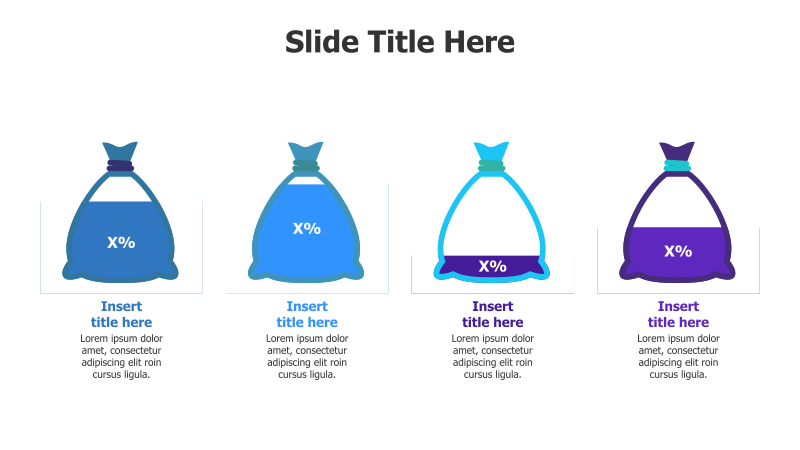
This template presents information using four stylized money bundles, each displaying a percentage value. It's ideal for illustrating proportional data or representing key financial components.
Layout & Structure: The slide features four distinct, bag-shaped icons arranged horizontally. Each icon represents a point and contains a placeholder for a percentage value ("X%"). Below each icon is a text area for a title and a brief description. The arrangement is linear and straightforward, facilitating easy comparison between the four points.
Style: The template employs a modern aesthetic with a 3D effect applied to the money bundle icons. Each bundle has a different color scheme (blue, light blue, dark blue, purple) and subtle shadows to enhance depth. The overall design is clean and professional, suitable for business presentations.
Use Cases:
- Presenting budget allocations across different departments.
- Illustrating market share distribution among competitors.
- Showing the percentage breakdown of project costs.
- Visualizing revenue streams from various sources.
- Highlighting key performance indicators (KPIs) with percentage targets.
Key Features:
- Fully editable icons and text.
- Clear visual representation of proportional data.
- Engaging 3D effect for enhanced impact.
- Customizable color schemes for branding.
- Simple and intuitive layout for easy understanding.
Tags:
Ready to Get Started?
Impress your audience and streamline your workflow with GraphiSlides!
Install Free Add-onNo credit card required for free plan.