4-Point Sales Bag Infographic
This template uses a visually appealing arrangement of shopping bags to represent four distinct points or categories.
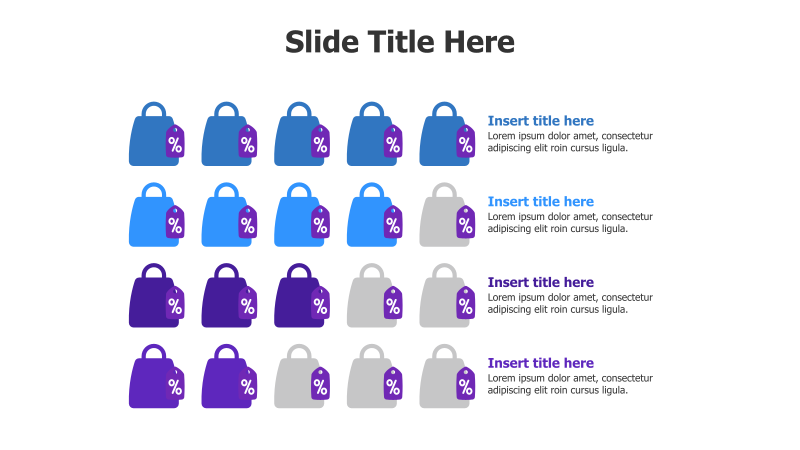
Layout & Structure: The template features four rows and four columns of shopping bag icons, totaling sixteen bags. Each bag contains a percentage symbol, suggesting a focus on data or proportions. A text area is positioned to the right of the bags, allowing for detailed descriptions of each point. The arrangement is grid-like, providing a clear and organized structure.
Style: The design incorporates a modern aesthetic with a 3D effect applied to the shopping bag icons. A gradient color scheme is used, with shades of purple and blue, creating a visually engaging and professional look. Subtle shadows enhance the depth and dimensionality of the bags.
Use Cases:
- Presenting sales figures for different product categories.
- Illustrating market share distribution.
- Showcasing the percentage breakdown of a project's budget.
- Comparing performance metrics across different departments.
- Visualizing customer demographics or preferences.
Key Features:
- Visually appealing 3D bag icons.
- Clear and organized grid layout.
- Easy to customize with your own data and text.
- Professional color scheme.
- Suitable for a variety of business presentations.
Tags:
Ready to Get Started?
Impress your audience and streamline your workflow with GraphiSlides!
Install Free Add-onNo credit card required for free plan.