4 Circular Charts with Indicator Dashboard
This template presents data using a combination of circular progress charts and horizontal progress bars, ideal for showcasing key metrics and performance indicators.
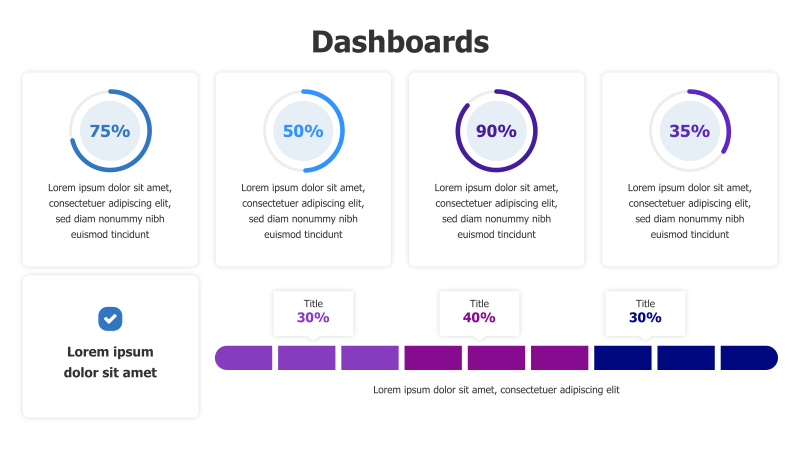
Layout & Structure: The template features four circular charts arranged in a 2x2 grid in the upper section, each displaying a percentage value. Below these, a section contains a checkmark icon with text, followed by three horizontal progress bars with associated titles and percentages. A descriptive text block sits beneath the progress bars.
Style: The design employs a flat, modern aesthetic with a clean color palette of blues, purples, and grays. The circular charts use contrasting colors to highlight the progress. The overall look is professional and easy to understand.
Use Cases:
- Presenting key performance indicators (KPIs).
- Displaying project progress.
- Reporting on sales or marketing metrics.
- Visualizing survey results or customer satisfaction data.
- Summarizing key findings in a report.
Key Features:
- Clear and concise data visualization.
- Visually appealing and modern design.
- Easy to customize with your own data and branding.
- Effective for highlighting progress and achievements.
- Suitable for a wide range of business presentations.
Tags:
Ready to Get Started?
Impress your audience and streamline your workflow with GraphiSlides!
Install Free Add-onNo credit card required for free plan.