Line Charts with Numbers Dashboard
This template presents a dashboard layout featuring line charts paired with key performance indicators (KPIs). It's designed for visually summarizing data and tracking progress.
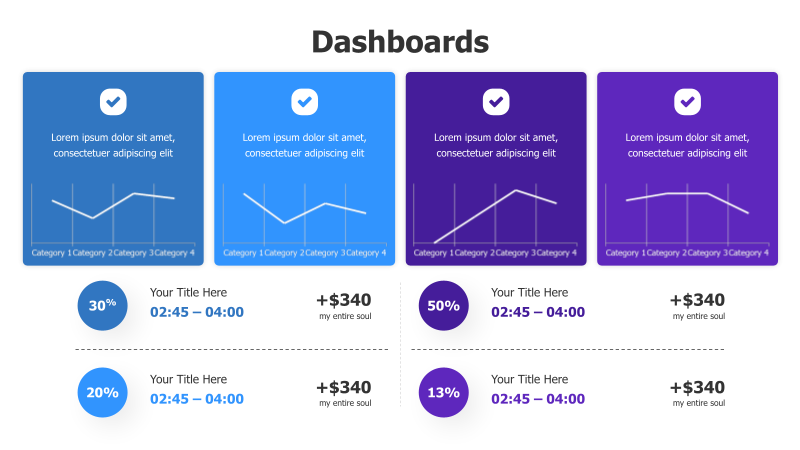
Layout & Structure: The template consists of four main sections, each containing a line chart above a set of KPI tiles. Each section is visually distinct with a blue background. Each section has two KPI tiles, one with a percentage and one with a dollar amount. The charts display data trends across four categories.
Style: The design employs a modern aesthetic with clean lines and a vibrant blue color scheme. A subtle checkmark icon is present in each chart section. The use of contrasting colors for the KPI tiles (green, red, and light blue) draws attention to key metrics. The overall style is professional and data-focused.
Use Cases:
- Tracking website traffic and user engagement.
- Monitoring sales performance and revenue growth.
- Presenting marketing campaign results.
- Reporting on project progress and milestones.
- Displaying financial data and key metrics.
Key Features:
- Visually appealing dashboard layout.
- Clear presentation of data trends.
- Highlighting of key performance indicators.
- Fully customizable charts and KPIs.
- Modern and professional design.
Tags:
Ready to Get Started?
Impress your audience and streamline your workflow with GraphiSlides!
Install Free Add-onNo credit card required for free plan.