Line Chart with Insights Dashboard
This dashboard template combines a line chart visualization with supporting text and icon-based callouts to present data-driven insights.
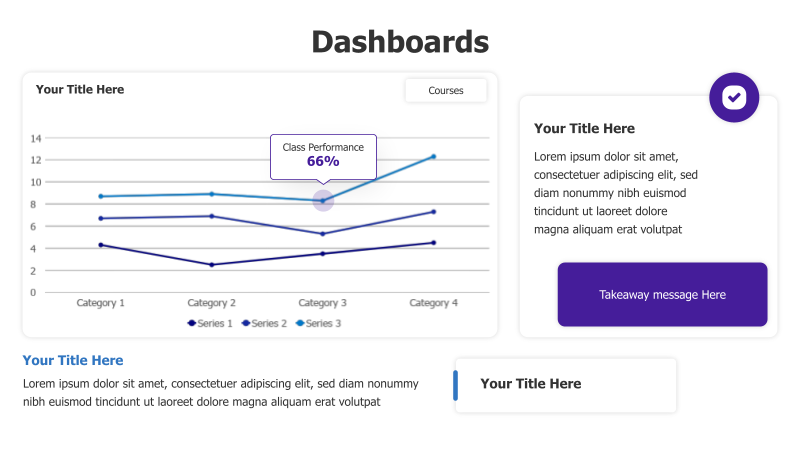
Layout & Structure: The template features a primary line chart occupying the left side, displaying data across four categories with three series. A prominent circular element highlights overall class performance. Two rectangular blocks on the right provide space for descriptive text and a takeaway message. A smaller text block is located below the chart.
Style: The design employs a clean, modern aesthetic with a light color palette. The line chart uses distinct colors for each series, enhancing readability. A checkmark icon adds a visual cue for positive outcomes or key takeaways. The use of rectangular blocks and a circular element provides visual contrast.
Use Cases:
- Presenting course performance data.
- Tracking key metrics over time.
- Highlighting trends and patterns in data.
- Communicating progress towards goals.
- Reporting on project milestones.
Key Features:
- Clear data visualization with a line chart.
- Space for detailed explanations and insights.
- Visually appealing design.
- Easy to customize with your own data and text.
- Includes a prominent call-to-action area for key takeaways.
Tags:
Ready to Get Started?
Impress your audience and streamline your workflow with GraphiSlides!
Install Free Add-onNo credit card required for free plan.