Weekly Performance Dashboard
This template presents a weekly performance overview using horizontal bar charts and progress indicators.
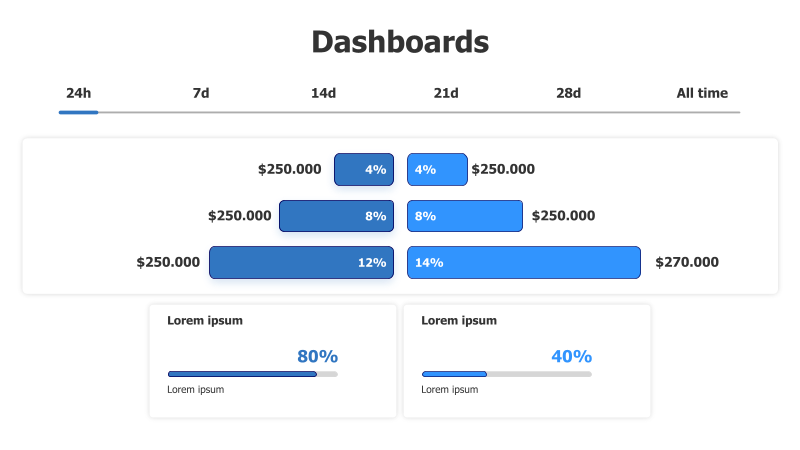
Layout & Structure: The template features a horizontal layout divided into sections representing different timeframes (24h, 7d, 14d, 21d, 28d, All time). It includes a series of horizontal bar charts displaying monetary values and percentage changes, alongside progress bars indicating completion rates for specific tasks or metrics. The layout is designed for easy comparison of performance across different periods.
Style: The design employs a clean, modern aesthetic with a blue color scheme. The use of horizontal bars and progress bars provides a clear and concise visual representation of data. The overall style is professional and data-driven.
Use Cases:
- Tracking weekly sales performance.
- Monitoring project progress over time.
- Visualizing key performance indicators (KPIs).
- Presenting financial data and growth trends.
- Reporting on website traffic and user engagement.
Key Features:
- Clear visual representation of data.
- Easy comparison of performance across timeframes.
- Modern and professional design.
- Suitable for a wide range of data types.
Tags:
Ready to Get Started?
Impress your audience and streamline your workflow with GraphiSlides!
Install Free Add-onNo credit card required for free plan.