3D Funnel and Doughnut Chart Dashboard
This template combines a visually engaging 3D funnel diagram with a doughnut chart and key metric displays, ideal for presenting data-driven insights.
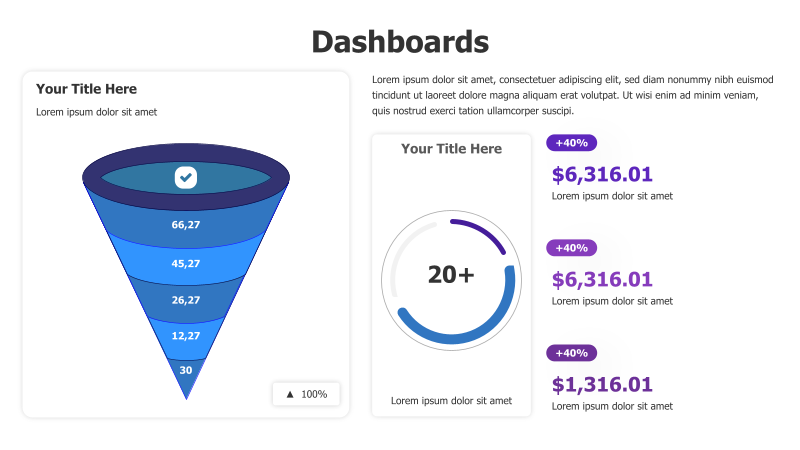
Layout & Structure: The template features a six-level 3D funnel diagram on the left, representing a process with decreasing stages. To the right, a doughnut chart displays a percentage or proportion, accompanied by three key metric cards with percentage increase indicators. The funnel's levels are stacked vertically, while the doughnut chart and metrics are arranged in a column.
Style: The design utilizes a modern aesthetic with a 3D effect on the funnel, creating depth and visual interest. A blue color scheme dominates, with white backgrounds for contrast. Subtle shadows enhance the 3D appearance. The overall style is professional and data-focused.
Use Cases:
- Sales funnel analysis and optimization
- Marketing campaign performance tracking
- Customer journey visualization
- Project stage progress reporting
- Key performance indicator (KPI) dashboards
Key Features:
- Visually appealing 3D funnel diagram
- Clear presentation of key metrics
- Percentage increase indicators for quick insights
- Modern and professional design
- Fully customizable elements
Tags:
Ready to Get Started?
Impress your audience and streamline your workflow with GraphiSlides!
Install Free Add-onNo credit card required for free plan.