Line Chart with Numbers Dashboard
This template presents a dashboard-style layout combining numerical data with a line chart for visual analysis.
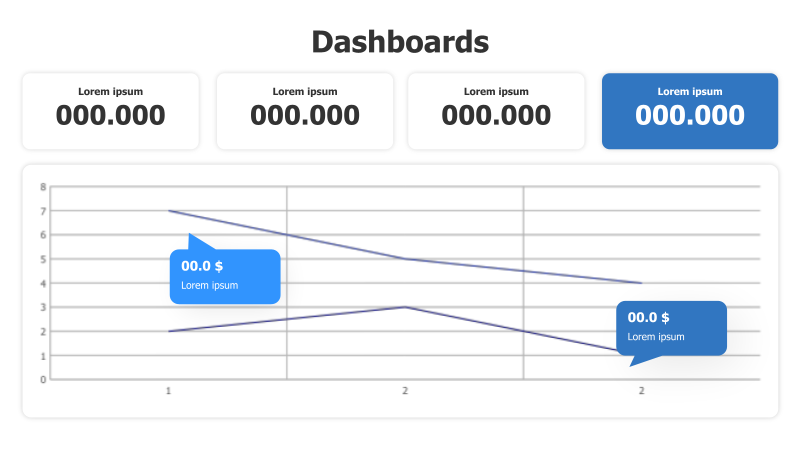
Layout & Structure: The template features a header with the title "Dashboards". Below the header, there are four rectangular boxes displaying numerical values with the placeholder text "Lorem ipsum 000.000". A line chart occupies the lower portion of the slide, displaying two lines with data points along the x-axis (labeled 0 to 2) and y-axis (labeled 0 to 8). Two data points on the chart are highlighted with blue boxes displaying "00.0 $ Lorem ipsum".
Style: The template employs a clean and modern aesthetic with a light blue and white color scheme. The boxes and chart are outlined with a light blue border. The overall style is professional and suitable for business presentations.
Use Cases:
- Presenting key performance indicators (KPIs).
- Tracking financial data and trends.
- Visualizing project progress and milestones.
- Reporting sales figures and market analysis.
- Displaying website traffic and user engagement metrics.
Key Features:
- Clear and concise data presentation.
- Visually appealing line chart for trend analysis.
- Customizable numerical values and chart data.
- Professional and modern design.
- Easy to understand and interpret.
Tags:
Ready to Get Started?
Impress your audience and streamline your workflow with GraphiSlides!
Install Free Add-onNo credit card required for free plan.