Funnel and Lines Charts Dashboard
This dashboard template combines a funnel chart with line charts to provide a comprehensive view of data progression and trends.
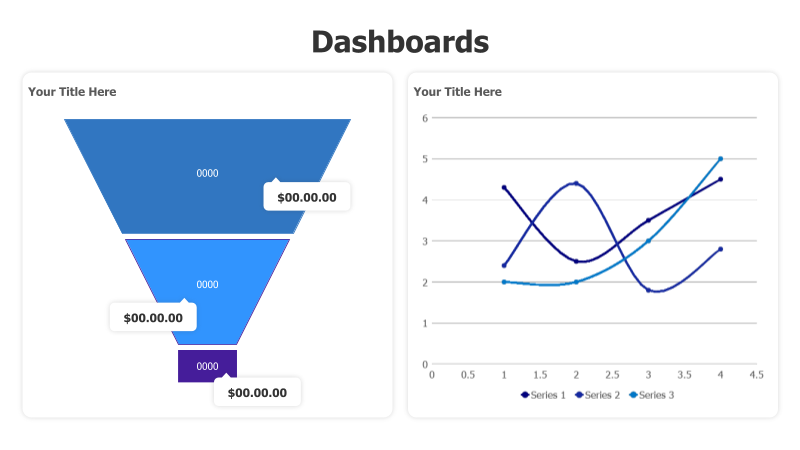
Layout & Structure: The template features a two-column layout. The left column displays a four-level funnel chart, visually representing a process with decreasing values at each stage. The right column contains a line chart with three series, displaying data trends over a numerical x-axis. Both charts have placeholder titles.
Style: The template utilizes a clean and modern aesthetic with a blue color scheme. The funnel chart has a 3D effect with subtle shadows, enhancing its visual appeal. The line chart employs distinct colors for each series, improving clarity. The overall design is professional and suitable for business presentations.
Use Cases:
- Sales pipeline visualization
- Marketing funnel analysis
- Financial performance tracking
- Project stage progression
- Website conversion rate monitoring
Key Features:
- Clear visual representation of data flow
- Easy-to-understand trends with line charts
- Customizable colors and labels
- Professional and modern design
- Suitable for various data types
Tags:
Ready to Get Started?
Impress your audience and streamline your workflow with GraphiSlides!
Install Free Add-onNo credit card required for free plan.