Line and Percentage Bar Charts Dashboard
This dashboard template combines line graphs with percentage-based bar charts to provide a comprehensive overview of key metrics.
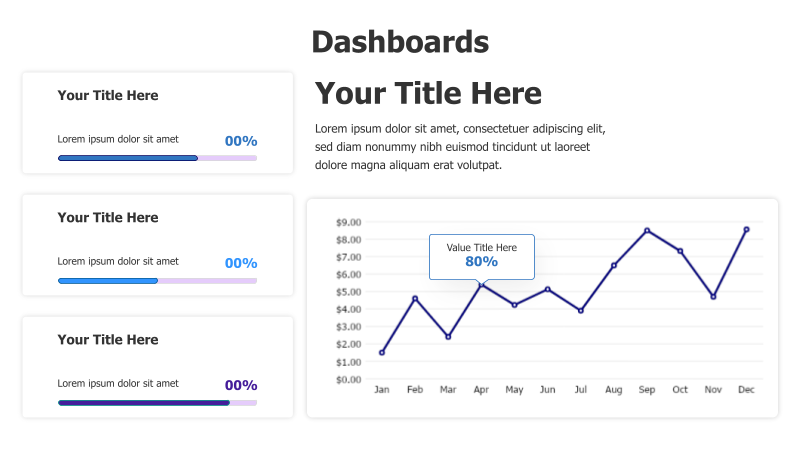
Layout & Structure: The template features a two-column layout. The left column contains three stacked bar charts, each representing a different metric with a percentage value. The right column includes a descriptive text area and a line graph illustrating trends over time (January to December). The line graph also includes a percentage value.
Style: The design is clean and modern, utilizing a light color palette with subtle blue accents. The charts are visually appealing and easy to interpret. The overall aesthetic is professional and data-driven.
Use Cases:
- Tracking key performance indicators (KPIs).
- Monitoring sales trends and growth.
- Presenting website traffic and engagement metrics.
- Reporting on project progress and milestones.
- Visualizing financial data and performance.
Key Features:
- Clear and concise data visualization.
- Easy-to-understand charts and graphs.
- Professional and modern design.
- Fully customizable elements.
- Suitable for a wide range of data sets.
Tags:
Ready to Get Started?
Impress your audience and streamline your workflow with GraphiSlides!
Install Free Add-onNo credit card required for free plan.