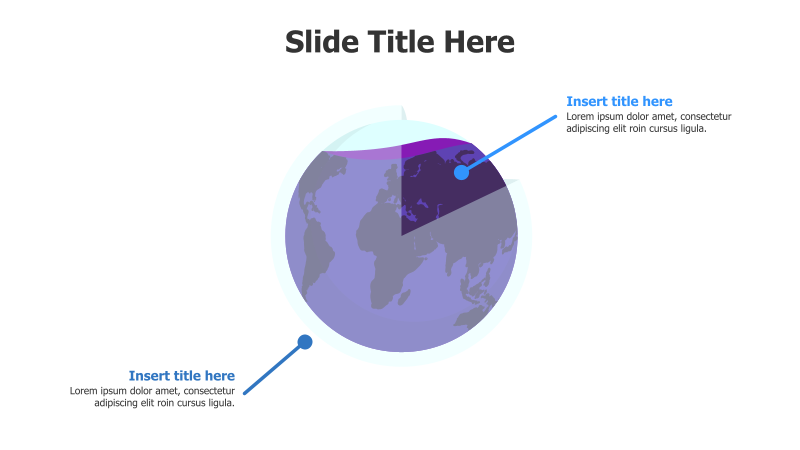
2-Point Divided Earth Infographic
This template presents data or concepts divided into two key areas, visualized using a globe graphic.
Layout & Structure: The template features a large, spherical representation of the Earth, divided into two distinct sections by a diagonal cut. Two callout boxes with titles and descriptions are positioned to the side, connected to the globe with lines. The overall structure is simple and focuses on a clear two-part comparison or breakdown.
Style: The design employs a modern aesthetic with a gradient color scheme on the Earth graphic. Subtle shadows and a clean font contribute to a professional look. The use of the Earth image adds a global or environmental context.
Use Cases:
- Presenting global market share.
- Comparing two regions or demographics.
- Illustrating opposing viewpoints or strategies.
- Highlighting two key aspects of a project.
- Demonstrating a before-and-after scenario.
Key Features:
- Visually engaging Earth graphic.
- Clear two-part division.
- Fully customizable text and colors.
- Suitable for a variety of data presentations.
- Simple and easy-to-understand layout.
Tags:
Ready to Get Started?
Impress your audience and streamline your workflow with GraphiSlides!
Install Free Add-onNo credit card required for free plan.