4-Point Pie Chart with Employee Infographics
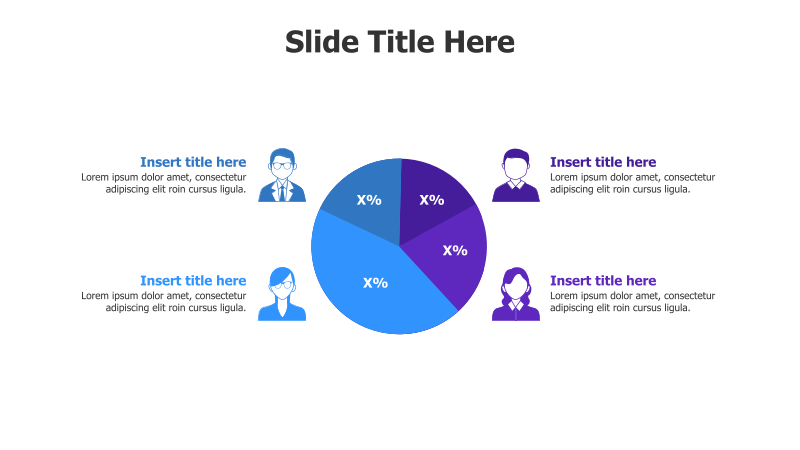
This template presents data using a four-section pie chart, complemented by stylized employee icons. It's ideal for showcasing proportional breakdowns and associating them with team members or departments.
Layout & Structure: The slide features a central four-section pie chart, with each section representing a percentage. Surrounding the chart are four rectangular blocks, each containing an illustration of a person wearing glasses and a suit, along with placeholder text. The layout is balanced and visually appealing.
Style: The template employs a modern aesthetic with a predominantly blue color scheme. The pie chart sections are shaded with varying tones of blue, and the employee icons are similarly colored. The use of flat design and subtle shadows adds depth without being overly distracting.
Use Cases:
- Presenting market share distribution.
- Illustrating budget allocation across departments.
- Showing the breakdown of project tasks by team member.
- Visualizing customer demographics.
- Reporting on sales performance by region.
Key Features:
- Fully editable pie chart sections and text.
- Professionally designed employee icons.
- Clear and concise visual representation of data.
- Easy to customize with your own branding and content.
- Suitable for a wide range of business presentations.
Tags:
Ready to Get Started?
Impress your audience and streamline your workflow with GraphiSlides!
Install Free Add-onNo credit card required for free plan.