3-Point Stacked Building Infographic
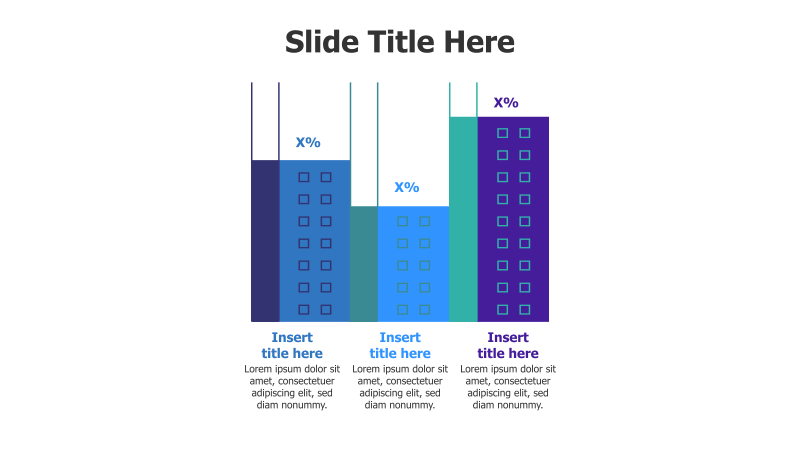
This template features a visually engaging infographic with three stacked building-like structures, ideal for presenting comparative data or hierarchical information.
Layout & Structure: The slide is organized around three rectangular blocks, resembling buildings, arranged horizontally. Each block is divided into smaller squares representing levels or components. The height of each block indicates a relative value, with percentage labels ('X%') displayed above each. The arrangement creates a clear visual comparison between the three points.
Style: The template employs a modern aesthetic with a 3D effect achieved through subtle shadows and color gradients. The color scheme utilizes shades of blue and teal, creating a professional and clean look. The use of squares within the blocks adds a structured and organized feel.
Use Cases:
- Comparing performance metrics across different departments.
- Illustrating the stages of a project or process.
- Presenting key features or benefits of three different products.
- Showcasing the relative importance of three strategic initiatives.
- Visualizing the foundation of a concept with increasing levels of detail.
Key Features:
- Fully editable shapes and text.
- Clear visual hierarchy for easy understanding.
- Engaging 3D effect to capture attention.
- Versatile design suitable for various business presentations.
- Percentage labels for quantitative comparison.
Tags:
Ready to Get Started?
Impress your audience and streamline your workflow with GraphiSlides!
Install Free Add-onNo credit card required for free plan.