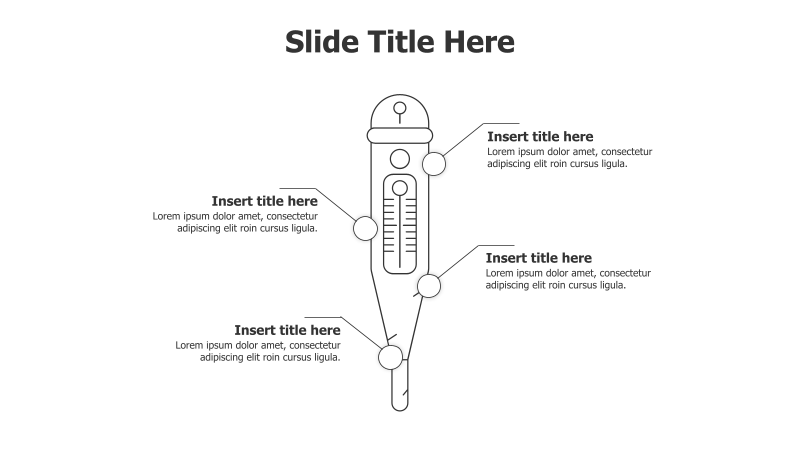
4-Point Thermometer Infographic
This slide template features a thermometer graphic with four labeled points, ideal for visually representing data or concepts with a tiered structure.
Layout & Structure:
- The template centers around a vertically oriented thermometer illustration.
- It includes four distinct points around the thermometer, each with a placeholder for a title and descriptive text.
- The arrangement creates a clear visual hierarchy, suggesting a scale or progression.
Style:
- The design employs a clean, minimalist aesthetic with a white background and simple line art.
- The thermometer graphic is rendered in a flat style with subtle shading.
- The overall look is professional and modern.
Use Cases:
- Presenting levels of customer satisfaction.
- Illustrating stages of a process or project.
- Displaying performance metrics with varying degrees of achievement.
- Representing risk assessment levels.
Key Features:
- Visually engaging thermometer graphic.
- Clear and concise layout.
- Fully customizable text and colors.
- Suitable for a wide range of data visualization needs.
Tags:
thermometerinfographic4 pointslevelsdataprocessstagesmetricsminimalistcleanmoderndiagram
Ready to Get Started?
Impress your audience and streamline your workflow with GraphiSlides!
Install Free Add-onNo credit card required for free plan.