4-Point Editable Outline Meters Infographic
This template features a clean and modern design ideal for showcasing progress, levels, or key metrics.
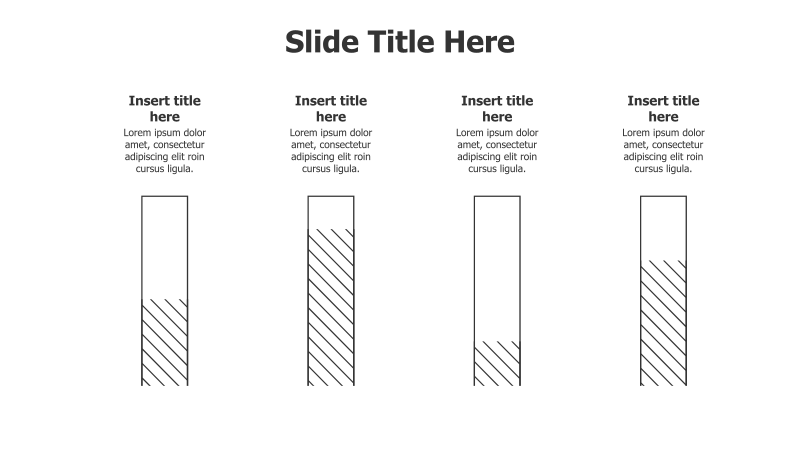
Layout & Structure: The slide is divided into four equal sections, each containing a rectangular "meter" graphic with diagonal lines indicating fill level. Each section also includes a title placeholder and a text area for supporting information. The arrangement is horizontal, creating a clear left-to-right flow.
Style: The template utilizes a minimalist aesthetic with a light color palette. The meters have a subtle outline effect, and the diagonal lines provide a visual indication of completion or progress. The overall look is professional and easy to understand.
Use Cases:
- Presenting project milestones and completion rates.
- Illustrating performance against key metrics.
- Showing levels of achievement or proficiency.
- Comparing different options or scenarios.
- Visualizing stages in a process.
Key Features:
- Fully editable shapes and text.
- Clear visual representation of progress.
- Modern and professional design.
- Easy to customize with your own data and branding.
Tags:
Ready to Get Started?
Impress your audience and streamline your workflow with GraphiSlides!
Install Free Add-onNo credit card required for free plan.