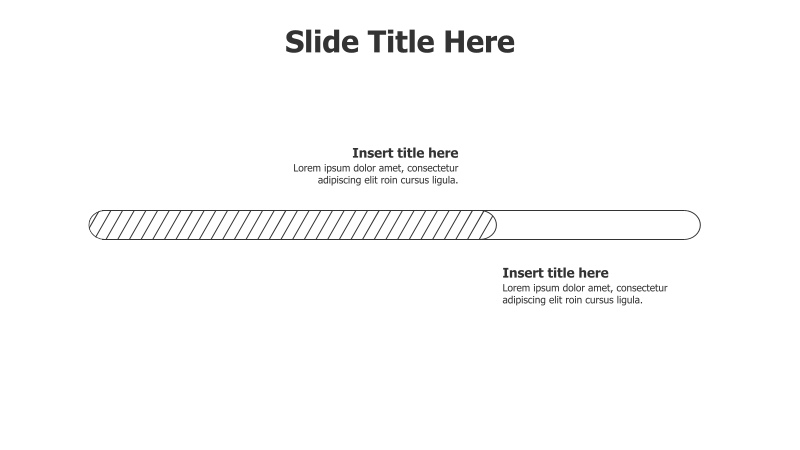
Editable Meter Infographic
This slide template features a horizontal meter graphic, ideal for visualizing progress, levels, or stages.
Layout & Structure: The template includes a central horizontal meter with rounded ends. There are two text placeholders, one above and one below the meter, each with a title and description area. The meter itself is a long, filled bar, suggesting completion or a scale. The layout is clean and straightforward.
Style: The design is minimalist and modern, utilizing a flat aesthetic with simple shapes and a neutral color palette. The meter has a subtle diagonal hatch pattern. The overall look is professional and easily adaptable to various branding guidelines.
Use Cases:
- Presenting project progress.
- Illustrating skill levels or proficiency.
- Showing completion rates.
- Visualizing performance metrics.
- Demonstrating stages in a process.
Key Features:
- Fully editable meter graphic.
- Clear visual representation of progress.
- Simple and clean design.
- Easy to customize with your own data and branding.
Tags:
Ready to Get Started?
Impress your audience and streamline your workflow with GraphiSlides!
Install Free Add-onNo credit card required for free plan.