5-Point 3D Divided Pie Chart
This template features a visually engaging 3D pie chart divided into five segments, ideal for showcasing proportional data or breaking down complex concepts.
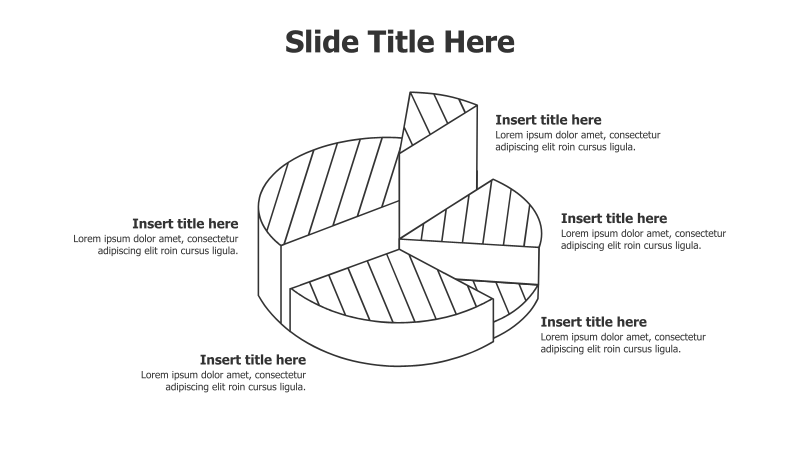
Layout & Structure: The template utilizes a 3D pie chart with five distinct sections. Each section is designed to hold a title and descriptive text. The chart is positioned on a clean, white background, allowing for clear focus on the data representation. The sections are arranged in a circular fashion, emphasizing the whole-part relationship.
Style: The design employs a minimalist aesthetic with clean lines and a subtle 3D effect. The outline style provides a modern and professional look. The color scheme is neutral, making it easily customizable to match any branding. The use of shadows adds depth and visual interest.
Use Cases:
- Presenting market share analysis.
- Illustrating budget allocation across different departments.
- Demonstrating the composition of a project's phases.
- Showing the breakdown of customer demographics.
- Visualizing the components of a strategic plan.
Key Features:
- Fully customizable colors and text.
- Clear and concise visual representation.
- Engaging 3D effect for enhanced impact.
- Easy to understand and interpret.
- Professional and modern design.
Tags:
Ready to Get Started?
Impress your audience and streamline your workflow with GraphiSlides!
Install Free Add-onNo credit card required for free plan.