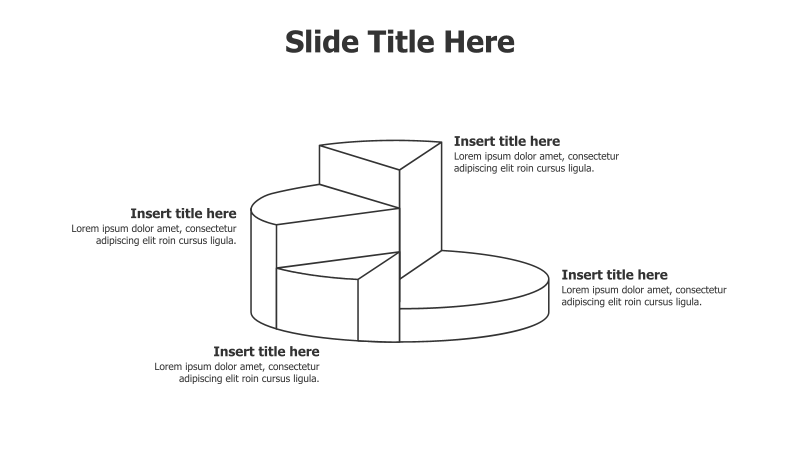
4-Point 3D Divided Pie Chart
This template features a visually engaging 3D pie chart divided into four sections, ideal for showcasing proportional data or key components.
Layout & Structure: The slide utilizes a 3D pie chart as its central element, divided into four distinct segments. Each segment is highlighted with a slightly raised effect, creating a sense of depth. Text boxes are positioned adjacent to each segment for labeling and providing supporting information. The overall structure is circular and emphasizes the relationship between the parts and the whole.
Style: The template employs a clean and modern aesthetic. The use of a 3D effect adds visual interest without being overly distracting. The color palette is neutral, allowing for easy customization. Subtle shadows enhance the depth and create a professional look.
Use Cases:
- Presenting market share analysis.
- Illustrating budget allocation across different departments.
- Demonstrating the composition of a project's phases.
- Showing the breakdown of customer demographics.
- Visualizing the key elements of a strategic plan.
Key Features:
- Fully customizable colors and text.
- Clear visual representation of proportional data.
- Engaging 3D effect for enhanced impact.
- Easy-to-understand layout.
- Suitable for a wide range of business presentations.
Tags:
Ready to Get Started?
Impress your audience and streamline your workflow with GraphiSlides!
Install Free Add-onNo credit card required for free plan.