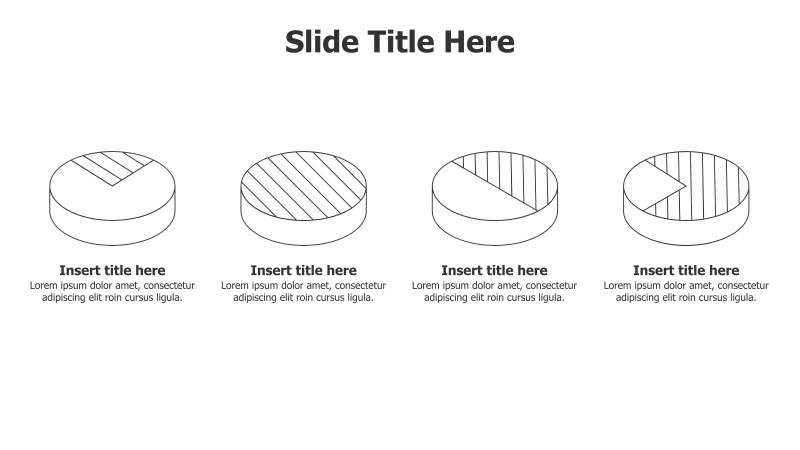
Four Outline 3D Pie Charts
This template features four 3D pie charts arranged horizontally, ideal for comparing proportional data across different categories.
Layout & Structure: The slide consists of four individual pie charts, each divided into segments with an outline style. They are positioned in a row, providing a clear side-by-side comparison. Each chart has a title placeholder below it and a descriptive text area.
Style: The template utilizes a clean, modern aesthetic with a 3D effect applied to the pie charts. The outline style provides a subtle visual separation between segments. The color scheme is neutral, allowing for easy customization. The overall look is professional and minimalist.
Use Cases:
- Presenting market share data for different products.
- Illustrating budget allocation across various departments.
- Comparing survey results or customer demographics.
- Showing the composition of a project's tasks or deliverables.
- Visualizing the breakdown of sales by region.
Key Features:
- Fully customizable colors and labels.
- Clear visual representation of proportional data.
- Professional and modern design.
- Easy to understand and interpret.
- Suitable for a wide range of business presentations.
Tags:
Ready to Get Started?
Impress your audience and streamline your workflow with GraphiSlides!
Install Free Add-onNo credit card required for free plan.