3-Point Editable Meter Infographic
This template presents information using three editable meter-style progress indicators. It's ideal for showcasing completion rates, performance levels, or stages of a process.
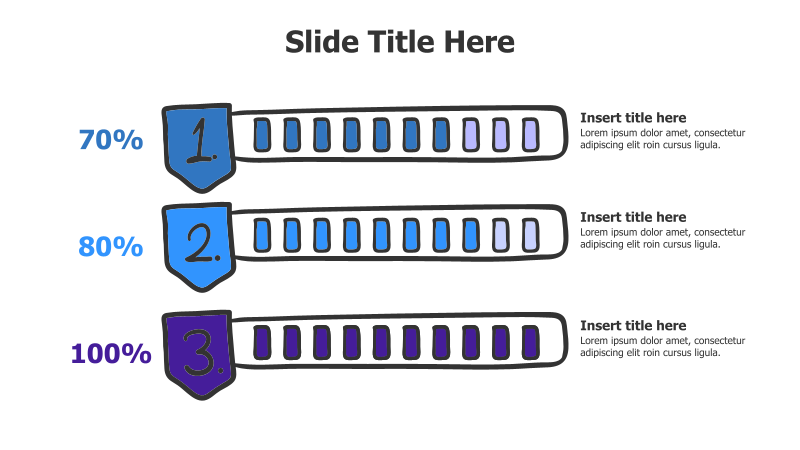
Layout & Structure: The slide features three horizontally arranged, meter-like shapes. Each meter is numbered (1, 2, 3) and displays a percentage (70%, 80%, 100%). Each meter has a series of rectangular blocks representing progress, with the filled blocks indicating the percentage complete. Text boxes are positioned to the right of each meter for detailed explanations.
Style: The template employs a clean, modern aesthetic with a flat design and subtle shadows. The meters utilize a color gradient (yellow, teal, purple) to visually differentiate each level. The overall look is professional and easy to understand.
Use Cases:
- Tracking project milestones and completion percentages.
- Illustrating performance against key metrics.
- Presenting stages of a process or workflow.
- Comparing different levels of achievement.
- Visualizing survey results or customer satisfaction scores.
Key Features:
- Fully editable percentages and text.
- Clear visual representation of progress.
- Engaging meter-style design.
- Easy to customize colors and fonts.
- Suitable for a variety of business and educational presentations.
Tags:
Ready to Get Started?
Impress your audience and streamline your workflow with GraphiSlides!
Install Free Add-onNo credit card required for free plan.