4-Step Fishbone Diagram with Icons
This template presents a four-step process or analysis using a unique fishbone infographic.
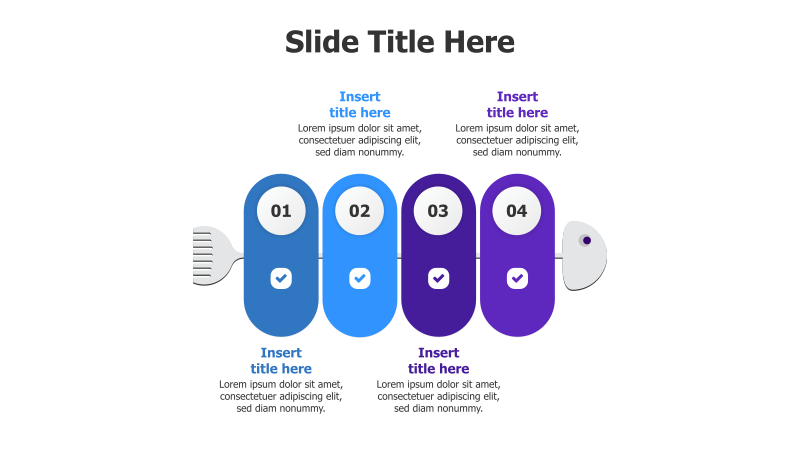
Layout & Structure: The template features a central "spine" resembling a fishbone, with four circular nodes branching off from it. Each node is numbered (01-04) and includes an icon and space for a title and description. The arrangement suggests a cause-and-effect relationship or a sequential process.
Style: The design incorporates a modern aesthetic with rounded shapes, vibrant blue and gray color scheme, and subtle shadows to create a 3D effect. The use of checkmark icons within each node adds a sense of completion or validation. The overall look is clean and professional.
Use Cases:
- Root cause analysis
- Problem-solving frameworks
- Process improvement initiatives
- Presenting sequential steps in a project
- Illustrating contributing factors to a specific outcome
Key Features:
- Visually engaging fishbone design
- Clear numbering and labeling for each step
- Customizable icons and text
- Modern and professional aesthetic
- Easy to understand and present complex information
Tags:
Ready to Get Started?
Impress your audience and streamline your workflow with GraphiSlides!
Install Free Add-onNo credit card required for free plan.