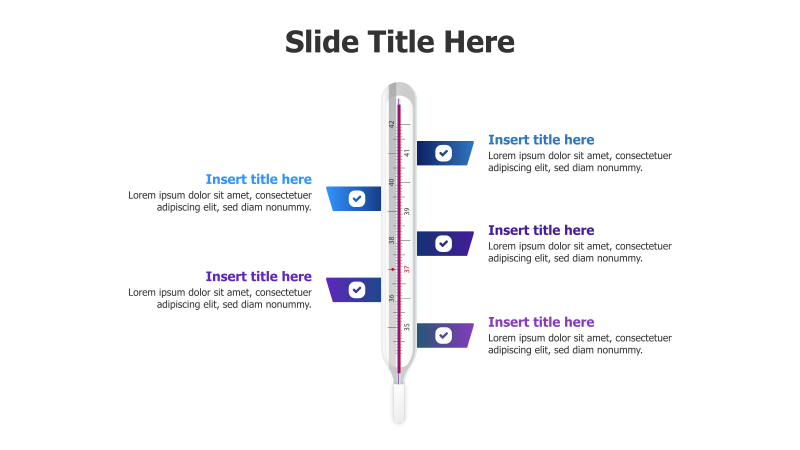
5-Point Thermometer Infographic
This slide template utilizes a thermometer graphic to visually represent five key points or stages. It's ideal for showcasing progress, levels of intensity, or performance metrics.
Layout & Structure:
- The template features a vertical thermometer illustration as the central visual element.
- Five distinct points are marked along the thermometer's scale, each accompanied by a checkmark icon.
- Each point has a dedicated text area for a title and a brief description.
- The layout is clean and balanced, with text positioned to the right of the thermometer.
Style:
- The design employs a modern and professional aesthetic.
- The thermometer graphic has a realistic appearance with subtle shading.
- The color scheme is primarily blue and red, creating a visually appealing contrast.
- The use of checkmark icons adds a sense of completion and positive reinforcement.
Use Cases:
- Presenting stages of a process or project.
- Illustrating levels of customer satisfaction.
- Displaying performance indicators or key metrics.
- Showcasing risk assessment levels.
- Representing the intensity of a problem or opportunity.
Key Features:
- Visually engaging thermometer graphic.
- Clear and concise presentation of five key points.
- Fully customizable text and colors.
- Professional and modern design.
- Easy to understand and interpret.
Tags:
thermometerinfographic5 pointslevelsprogressmetricsstagesprocessbusinessmodernprofessionaldiagramchecklist
Ready to Get Started?
Impress your audience and streamline your workflow with GraphiSlides!
Install Free Add-onNo credit card required for free plan.