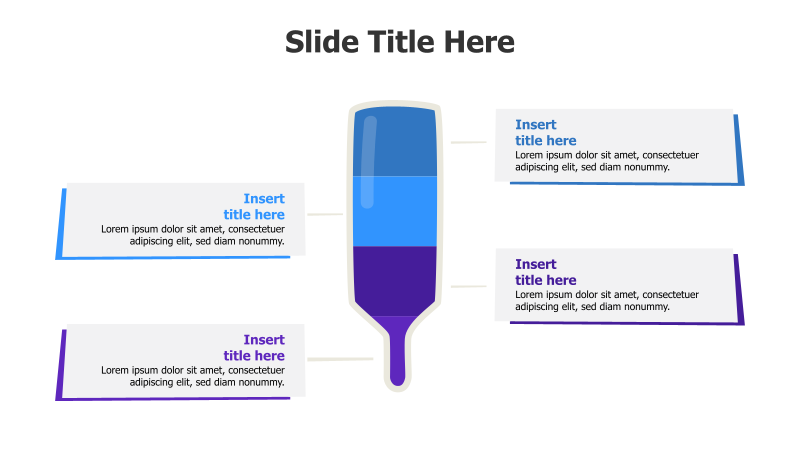
4-Point Divided Colored Thermometer Infographic
This template presents information using a visually engaging thermometer-like structure with four distinct sections.
Layout & Structure:
- The template features a central vertical element resembling a thermometer, divided into four horizontal sections.
- Each section is represented by a differently colored rectangular block connected to the central element.
- Text boxes are provided within each section for titles and descriptions.
- The arrangement flows from bottom to top, suggesting a progression or increasing intensity.
Style:
- The design incorporates a 3D effect with subtle shadows, adding depth and visual appeal.
- The color scheme uses shades of blue and purple, creating a modern and professional aesthetic.
- The overall style is clean and minimalist, focusing on clarity and readability.
Use Cases:
- Presenting performance metrics and key performance indicators (KPIs).
- Illustrating stages of a process or project.
- Comparing different options or levels of achievement.
- Visualizing a scale of values or priorities.
- Demonstrating a range of customer satisfaction levels.
Key Features:
- Fully customizable colors and text.
- Clear visual hierarchy for easy understanding.
- Engaging 3D effect to capture attention.
- Versatile design suitable for various business applications.
- Easy to integrate with existing presentations.
Tags:
thermometer4 pointsinfographicprocessstagesmetricskpibusinessdiagram3dcolorfulhierarchyscale
Ready to Get Started?
Impress your audience and streamline your workflow with GraphiSlides!
Install Free Add-onNo credit card required for free plan.