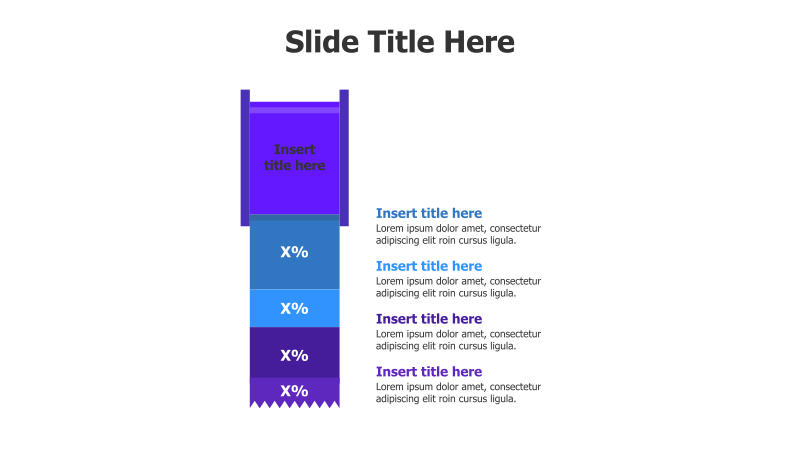
4-Level Stacked Bar Infographic
This template presents information in a visually engaging stacked bar format, ideal for showcasing proportional data or hierarchical relationships.
Layout & Structure: The template features a vertical stacked bar diagram composed of four distinct levels. Each level is represented by a rectangular bar segment, with the top level containing a text box for a title. The remaining levels display percentage values. The bars are arranged in a descending order, creating a clear visual flow.
Style: The design incorporates a modern aesthetic with a light blue and purple color scheme. The bars have a subtle 3D effect with shadows, enhancing their depth and visual appeal. The overall style is clean and professional.
Use Cases:
- Presenting market share distribution.
- Illustrating the breakdown of project costs.
- Demonstrating the stages of a process with associated completion percentages.
- Visualizing the composition of a customer base.
- Showing the relative importance of different factors.
Key Features:
- Fully customizable colors and text.
- Clear visual representation of proportional data.
- Engaging 3D effect for enhanced impact.
- Easy-to-understand percentage labels.
- Suitable for a wide range of business and educational presentations.
Tags:
Ready to Get Started?
Impress your audience and streamline your workflow with GraphiSlides!
Install Free Add-onNo credit card required for free plan.