Fishbone Diagram Template
This template provides a visually engaging fishbone diagram, ideal for root cause analysis and problem-solving.
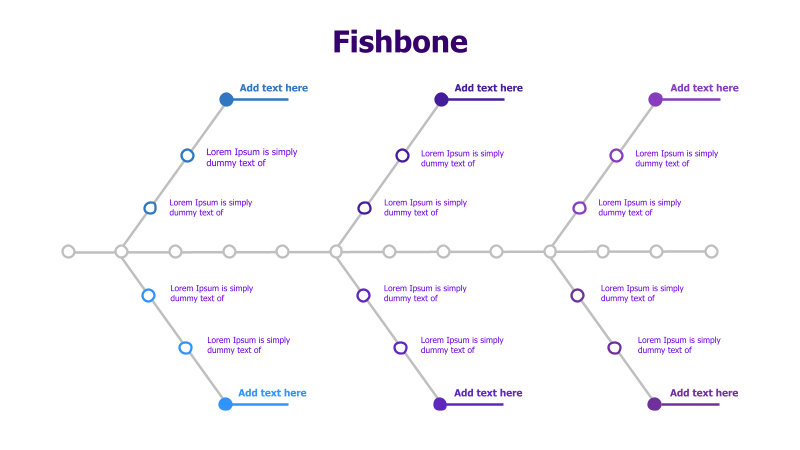
Layout & Structure: The template features a classic fishbone (Ishikawa) diagram layout. A central horizontal line represents the problem, and angled lines branching off represent potential causes. Each cause branch has multiple sub-branches, creating a multi-level structure for detailed analysis. The diagram includes three main cause categories, each with four sub-causes.
Style: The diagram utilizes a clean, modern aesthetic with a purple and teal color scheme. Lines are smooth and curved, and circular nodes highlight key points. The overall design is professional and easy to read.
Use Cases:
- Root cause analysis of business problems
- Identifying factors contributing to project delays
- Analyzing quality control issues
- Troubleshooting technical malfunctions
- Brainstorming potential solutions
Key Features:
- Clear visual representation of cause-and-effect relationships
- Fully customizable text and colors
- Easy to understand and present
- Suitable for a wide range of problem-solving scenarios
Tags:
Ready to Get Started?
Impress your audience and streamline your workflow with GraphiSlides!
Install Free Add-onNo credit card required for free plan.