Fishbone Diagram Template
This template provides a visually engaging Fishbone diagram, also known as an Ishikawa diagram, for root cause analysis.
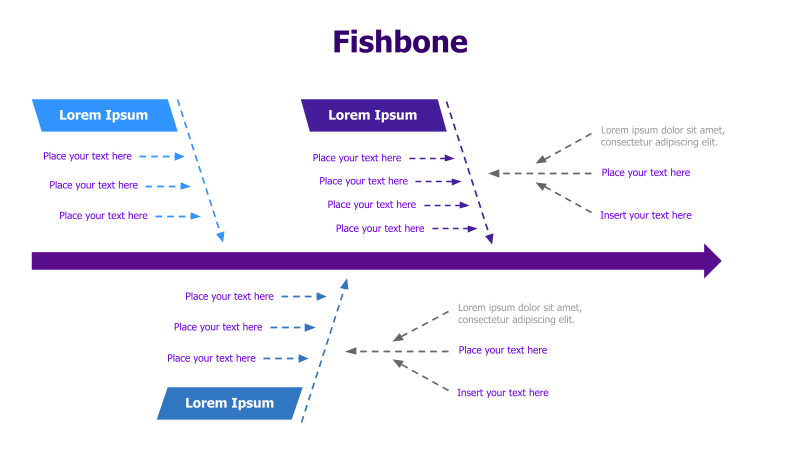
Layout & Structure: The template features a central horizontal arrow representing the problem statement. Six angled lines branch off from this arrow, resembling the bones of a fish. Each 'bone' has multiple smaller branches for detailing potential causes. There are three main branches on the top and three on the bottom, each with several sub-branches for detailed analysis. The template includes placeholder text for each section.
Style: The design utilizes a clean, modern aesthetic with a color palette of blues and purples. Dashed lines connect the branches, creating a clear visual flow. The use of color-coded boxes for main categories enhances readability. The overall style is professional and suitable for business presentations.
Use Cases:
- Root cause analysis of problems or issues.
- Identifying potential factors contributing to a specific outcome.
- Brainstorming sessions to explore possible causes.
- Quality control and process improvement.
- Problem-solving in manufacturing, healthcare, or service industries.
Key Features:
- Fully editable text boxes.
- Clear visual representation of cause-and-effect relationships.
- Easy to customize with your own data.
- Professional and modern design.
- Suitable for a wide range of problem-solving scenarios.
Tags:
Ready to Get Started?
Impress your audience and streamline your workflow with GraphiSlides!
Install Free Add-onNo credit card required for free plan.