Colored Circular and Flat Indicators Dashboard
This dashboard template combines circular progress indicators with flat bar charts to present key metrics and data points in a visually appealing manner.
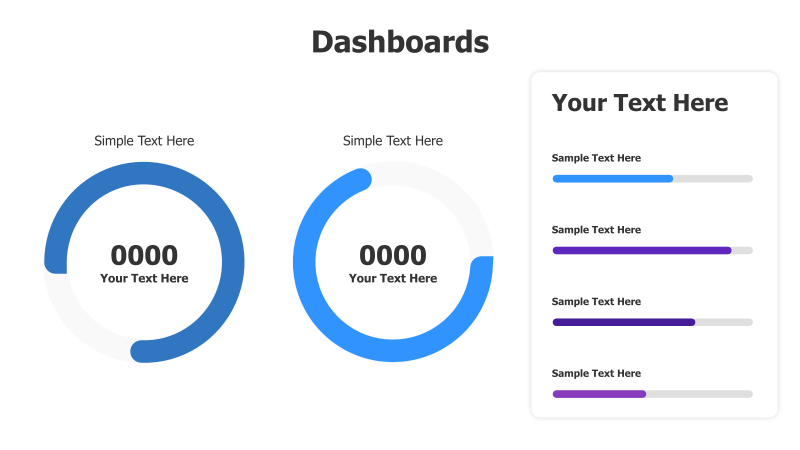
Layout & Structure: The template features two large circular indicators on the left side, each with a numerical value displayed prominently in the center. To the right, a rectangular section contains four horizontal bar charts, each labeled with descriptive text. The layout is clean and balanced, designed for easy data comprehension.
Style: The template employs a modern and professional aesthetic. The circular indicators utilize a bright blue color scheme with subtle shadows, creating a sense of depth. The bar charts use a combination of blue, purple, and gray tones for visual differentiation. The overall style is minimalist and focuses on clarity.
Use Cases:
- Presenting key performance indicators (KPIs).
- Tracking progress towards goals.
- Displaying survey results or data analysis.
- Creating executive summaries.
- Monitoring project milestones.
Key Features:
- Visually engaging circular and flat indicators.
- Clear and concise data presentation.
- Fully customizable colors and text.
- Suitable for a wide range of data types.
- Easy to understand and interpret.
Tags:
Ready to Get Started?
Impress your audience and streamline your workflow with GraphiSlides!
Install Free Add-onNo credit card required for free plan.