Line Chart with Flat Indicators Dashboard
This dashboard template combines a line chart with flat indicator blocks to present key metrics and progress updates.
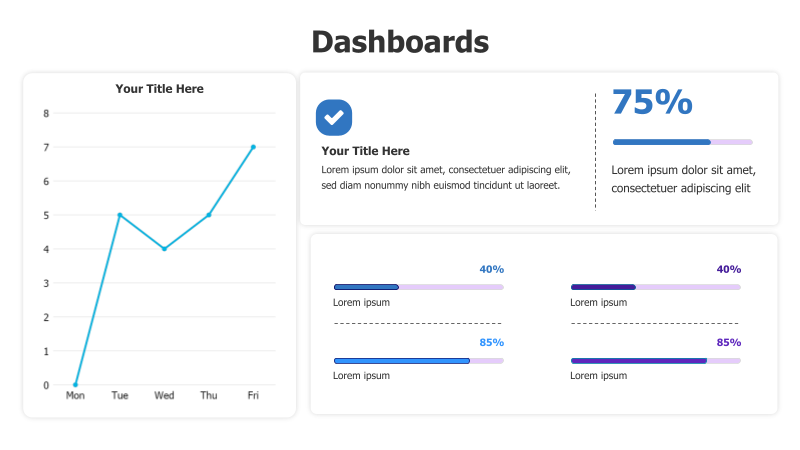
Layout & Structure: The template features a three-column layout. The first column contains a line chart visualizing data trends over time (Mon-Fri). The remaining two columns are dedicated to flat indicator blocks, each containing text descriptions and progress bars. Each indicator block has two progress bars.
Style: The design employs a clean, modern aesthetic with a light color palette. The line chart uses a simple line with clear axis labels. The indicator blocks utilize flat design principles with subtle color accents for the progress bars. The overall look is professional and easy to understand.
Use Cases:
- Tracking website traffic and user engagement.
- Monitoring sales performance and key metrics.
- Presenting project progress and milestones.
- Reporting on marketing campaign results.
- Displaying key performance indicators (KPIs).
Key Features:
- Visually appealing dashboard layout.
- Clear and concise data presentation.
- Easy-to-understand progress indicators.
- Fully customizable charts and indicators.
- Suitable for a wide range of business applications.
Tags:
Ready to Get Started?
Impress your audience and streamline your workflow with GraphiSlides!
Install Free Add-onNo credit card required for free plan.