Dashboard with Key Metrics and Trend Chart
This slide template presents a dashboard-style layout ideal for showcasing key performance indicators and trends.
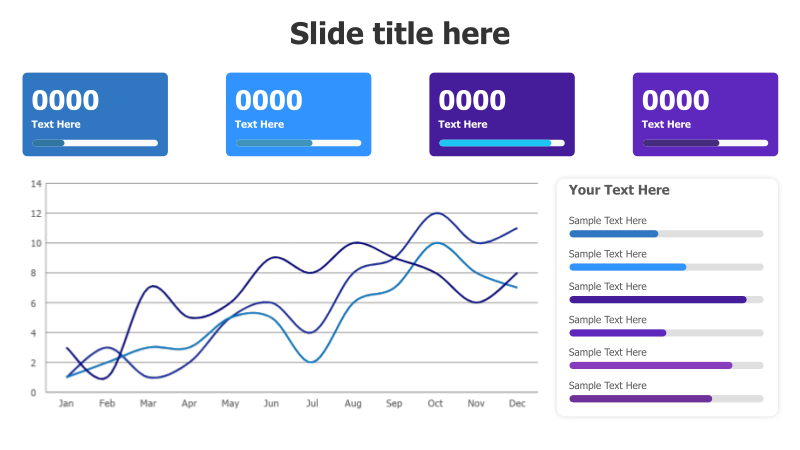
Layout & Structure: The template features four colored rectangular blocks at the top, each designed to highlight a specific metric with a numerical value and descriptive text. Below these blocks is a line chart displaying data trends over a 12-month period (Jan-Dec). A text area is positioned to the right of the chart for additional insights or explanations.
Style: The design employs a modern aesthetic with vibrant, contrasting colors for the blocks (blue, cyan, purple). The line chart uses distinct colors for each data series, enhancing visual clarity. The overall style is clean and professional, suitable for business presentations.
Use Cases:
- Presenting sales performance metrics.
- Tracking website traffic and user engagement.
- Monitoring project progress and key milestones.
- Reporting financial data and key ratios.
- Displaying marketing campaign results.
Key Features:
- Visually appealing dashboard layout.
- Clear and concise data presentation.
- Customizable color scheme.
- Fully editable text and data.
- Effective for highlighting key performance indicators.
Tags:
Ready to Get Started?
Impress your audience and streamline your workflow with GraphiSlides!
Install Free Add-onNo credit card required for free plan.