3-Point Gradient Figures with Percentages
This template presents information using three distinct figures, each associated with a percentage value. It's ideal for showcasing comparative data or highlighting key contributions.
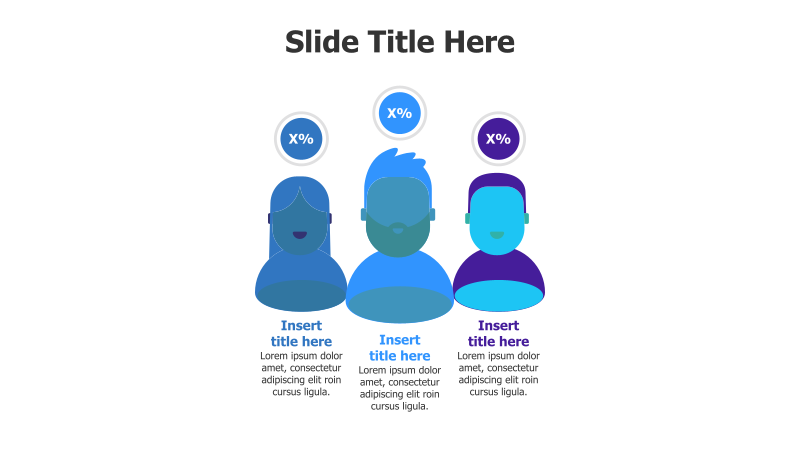
Layout & Structure: The slide features three vertically aligned figures, each with a gradient color scheme. Above each figure is a circular placeholder for a percentage value. Below each figure is a text area for a title and supporting description. The arrangement creates a clear, side-by-side comparison.
Style: The template employs a modern aesthetic with a gradient color palette (blues and purples). The figures have a slightly 3D appearance with subtle shadows, adding depth and visual interest. The overall style is professional and clean.
Use Cases:
- Presenting market share data for three competitors.
- Illustrating the contribution of three team members to a project.
- Comparing the performance of three different strategies.
- Showcasing three key features of a product or service.
- Representing three stages of a process with associated completion percentages.
Key Features:
- Fully customizable colors and text.
- Clear visual representation of comparative data.
- Engaging gradient and 3D effects.
- Easy-to-understand percentage indicators.
- Suitable for a wide range of business presentations.
Tags:
Ready to Get Started?
Impress your audience and streamline your workflow with GraphiSlides!
Install Free Add-onNo credit card required for free plan.