3 Points Different Filling Outline Circles Infographic
This template presents information using three circular diagrams with varying fill levels to represent percentages or proportions.
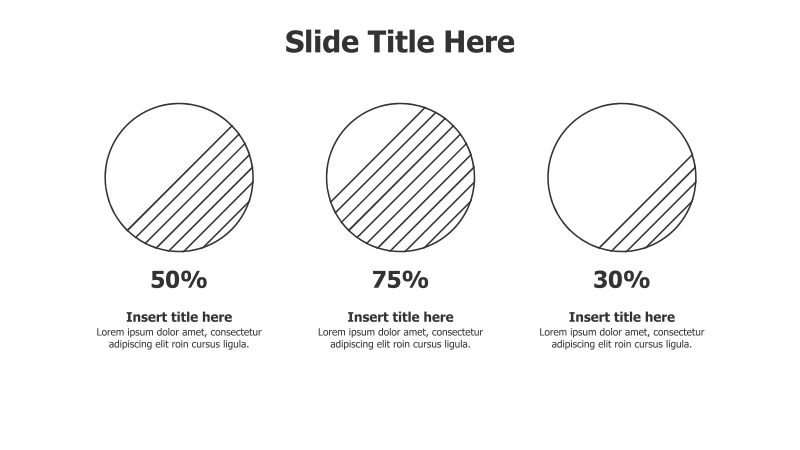
Layout & Structure: The slide features three circles arranged horizontally. Each circle is partially filled with diagonal lines, representing 50%, 75%, and 30% respectively. Below each circle is a placeholder for a title and a short description.
Style: The template employs a clean, minimalist aesthetic with a grayscale color scheme. The circles are outlined, and the fill uses simple diagonal lines for a clear visual representation of the percentages. The overall style is professional and easy to understand.
Use Cases:
- Presenting survey results or data breakdowns.
- Illustrating project completion percentages.
- Comparing different levels of progress or achievement.
- Showing the distribution of resources or budget.
- Highlighting varying degrees of importance or impact.
Key Features:
- Clear and concise visual representation of percentages.
- Easy to customize with your own data and titles.
- Professional and modern design.
- Versatile for a wide range of applications.
Tags:
Ready to Get Started?
Impress your audience and streamline your workflow with GraphiSlides!
Install Free Add-onNo credit card required for free plan.