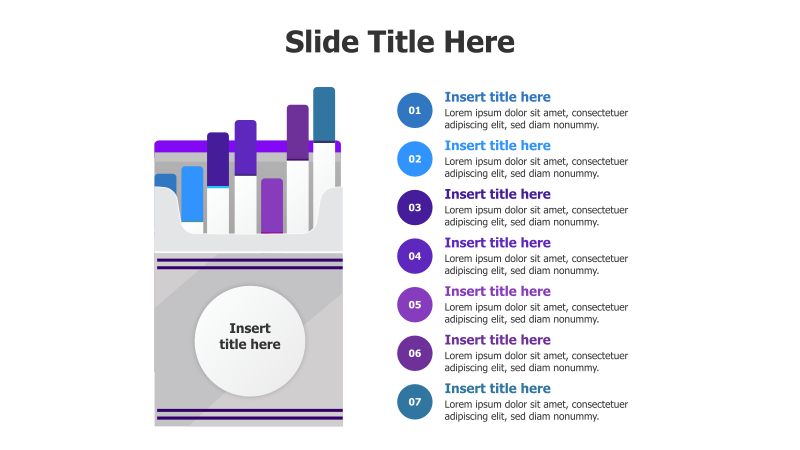
7-Step Infographic with Bar Chart & Circle
This template combines a bar chart visualization with a numbered list and a circular diagram to present information in a structured and engaging manner.
Layout & Structure:
- The slide features a bar chart on the left, a numbered list of seven points on the right, and a circular diagram at the bottom.
- The bar chart is composed of stacked, 3D-effect bars.
- The numbered list uses circular icons with a dark blue fill.
- The circular diagram is segmented and provides space for a central title.
Style:
- The template utilizes a modern aesthetic with a color palette of blues, purples, and grays.
- 3D effects and shadows are used to create depth and visual interest.
- The overall design is clean and professional.
Use Cases:
- Presenting key steps in a process.
- Highlighting important features or benefits.
- Illustrating a sequence of events.
- Showcasing data trends alongside supporting information.
- Explaining a multi-faceted concept.
Key Features:
- Fully editable shapes and text.
- Visually appealing 3D effects.
- Clear and organized layout.
- Versatile for various business and educational presentations.
Tags:
infographic7 stepsbar chartcircle diagramprocessstepsnumbered list3dbusinessmoderndata visualizationdiagram
Ready to Get Started?
Impress your audience and streamline your workflow with GraphiSlides!
Install Free Add-onNo credit card required for free plan.