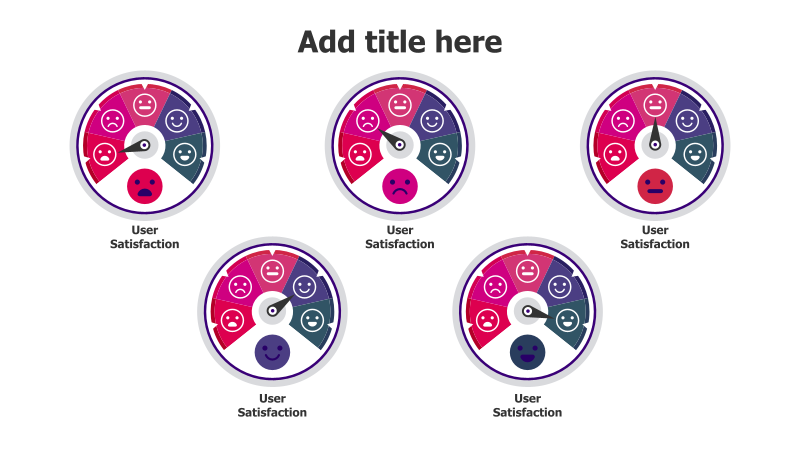
5-Level User Satisfaction Meters
This template features a series of circular meters designed to visually represent user satisfaction levels.
Layout & Structure: The slide displays five identical circular diagrams, each divided into five segments. Each segment contains a different facial expression representing a level of satisfaction (from very unhappy to very happy). The circles are arranged in two rows, with three circles in the top row and two in the bottom row. Each circle has a label below it reading "User Satisfaction".
Style: The template utilizes a modern and clean aesthetic. The circles employ a color scheme of red, pink, and blue, with subtle gradients and shadows to create a sense of depth. The use of facial expressions adds a human touch and makes the data more relatable. The overall design is visually appealing and easy to understand.
Use Cases:
- Presenting user feedback from surveys or questionnaires.
- Illustrating customer satisfaction scores for different products or services.
- Tracking user sentiment over time.
- Comparing satisfaction levels across different user groups.
- Demonstrating the impact of improvements on user experience.
Key Features:
- Visually engaging representation of user satisfaction.
- Clear and concise display of data.
- Easy to customize with different satisfaction levels and labels.
- Professional and modern design.
- Suitable for a wide range of presentations.
Tags:
Ready to Get Started?
Impress your audience and streamline your workflow with GraphiSlides!
Install Free Add-onNo credit card required for free plan.