Monthly Performance Dashboard
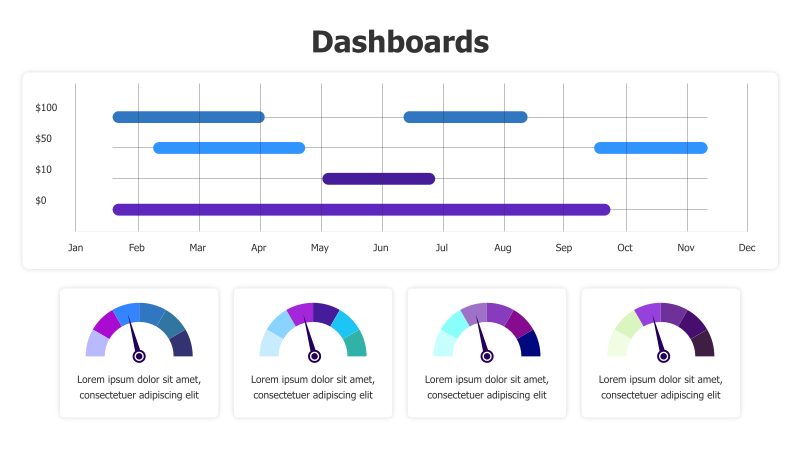
This template presents a dashboard view of monthly performance data, combining a bar chart with individual performance meters.
Layout & Structure: The slide features a horizontal bar chart displaying performance metrics across twelve months (January to December). Each month is represented on the x-axis, and performance values are shown on the y-axis, ranging from $0 to $100. Below the bar chart, there are four individual gauge/meter charts, each accompanied by placeholder text.
Style: The template utilizes a clean and modern aesthetic with a light background. The bar chart employs a color scheme of red, purple, and blue to differentiate data points. The meters use a semi-circular gauge design with a gradient color scheme. The overall style is professional and data-focused.
Use Cases:
- Tracking monthly sales figures.
- Monitoring key performance indicators (KPIs).
- Presenting project progress over time.
- Visualizing financial performance.
- Reporting on website traffic or user engagement.
Key Features:
- Clear visual representation of monthly trends.
- Individual meters for detailed performance insights.
- Fully customizable data points and labels.
- Professional and modern design.
- Easy-to-understand format for data presentation.
Tags:
Ready to Get Started?
Impress your audience and streamline your workflow with GraphiSlides!
Install Free Add-onNo credit card required for free plan.