4-Point Circular Percentage Breakdown
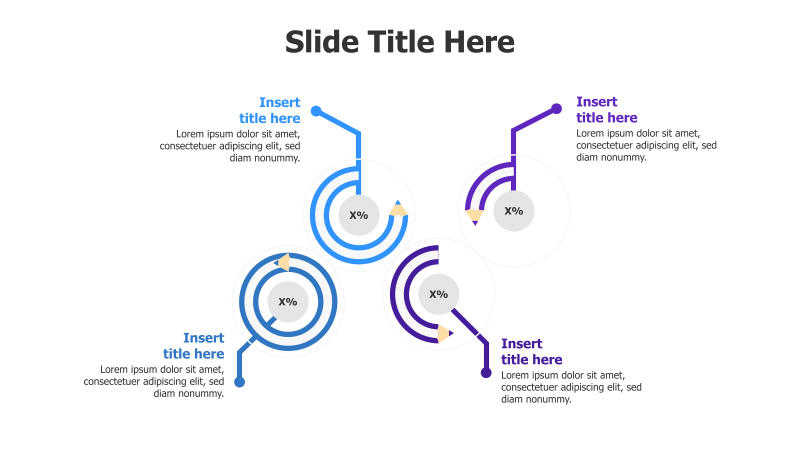
This template presents a circular diagram divided into four segments, each representing a percentage of a whole. It's ideal for showcasing proportional data or breaking down components of a larger system.
Layout & Structure: The template features a central circle surrounded by four larger, circular segments. Each segment is connected to the center with a curved line. Each segment contains a placeholder for a percentage value ('X%') and associated text. The arrangement is symmetrical and emphasizes the proportional relationship between the four points.
Style: The design employs a modern aesthetic with a light color palette and blue accents. The use of circular shapes and curved lines creates a visually appealing and dynamic layout. Subtle shadows add depth and a slight 3D effect.
Use Cases:
- Presenting market share distribution.
- Illustrating budget allocation across departments.
- Showing the breakdown of project tasks.
- Visualizing customer demographics.
- Analyzing survey results.
Key Features:
- Fully customizable colors and text.
- Clear visual representation of proportional data.
- Easy-to-understand layout.
- Professional and modern design.
Tags:
Ready to Get Started?
Impress your audience and streamline your workflow with GraphiSlides!
Install Free Add-onNo credit card required for free plan.