Four Test Tube Comparison Infographic
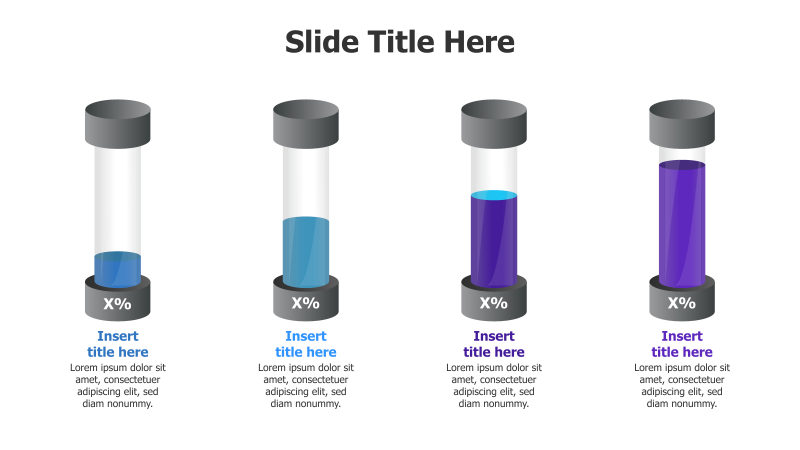
This template presents data or concepts using four visually distinct test tubes, each with a varying level of fill.
Layout & Structure: The slide features four cylindrical test tubes arranged horizontally. Each tube has a dark gray cap and a transparent body, filled with a gradient color (blue/purple) to indicate a percentage or level. Below each tube is a placeholder for a title and descriptive text.
Style: The template employs a modern, clean aesthetic with a 3D effect applied to the test tubes, creating depth and visual interest. Subtle shadows enhance the 3D appearance. The color scheme is professional, utilizing shades of gray, blue, and purple.
Use Cases:
- Comparing performance metrics across different departments.
- Illustrating the progress of multiple projects.
- Presenting different levels of risk or impact.
- Showcasing varying degrees of completion for tasks.
- Visualizing survey results or data points.
Key Features:
- Fully customizable fill levels and colors.
- Clear visual representation of comparative data.
- Easy-to-understand infographic format.
- Professional and modern design.
- Placeholders for titles and descriptions.
Tags:
Ready to Get Started?
Impress your audience and streamline your workflow with GraphiSlides!
Install Free Add-onNo credit card required for free plan.