2 Outline Editable Meters with Percentage Infographic
This slide template features a clean and straightforward design for visually representing progress or completion rates.
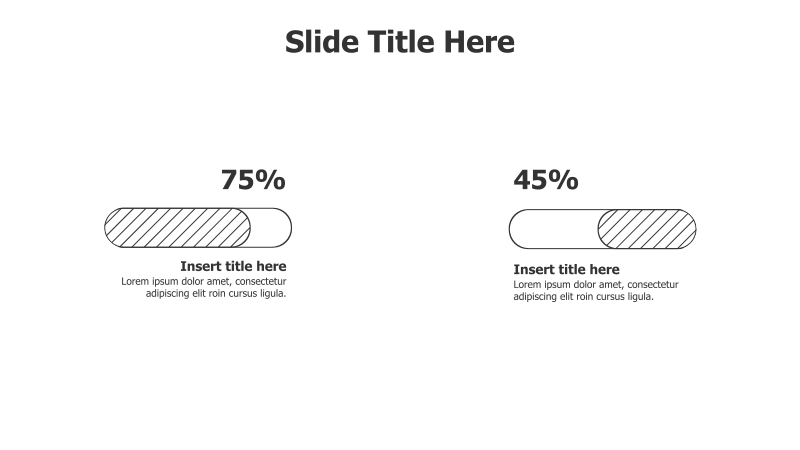
Layout & Structure: The slide contains two horizontal meter gauges, each with an outline and a filled portion indicating a percentage. The percentages (75% and 45%) are displayed above each meter. Below each meter is a placeholder for a title and descriptive text.
Style: The template employs a minimalist aesthetic with a simple color scheme (gray and white). The use of outlines and filled sections provides a clear visual representation of the data. The overall style is professional and easy to understand.
Use Cases:
- Presenting project completion status.
- Illustrating progress towards goals.
- Comparing performance metrics.
- Showing survey results or data percentages.
- Highlighting key achievements.
Key Features:
- Fully editable percentages and text.
- Clear and concise visual representation.
- Simple and professional design.
- Easy to understand and interpret.
Tags:
Ready to Get Started?
Impress your audience and streamline your workflow with GraphiSlides!
Install Free Add-onNo credit card required for free plan.