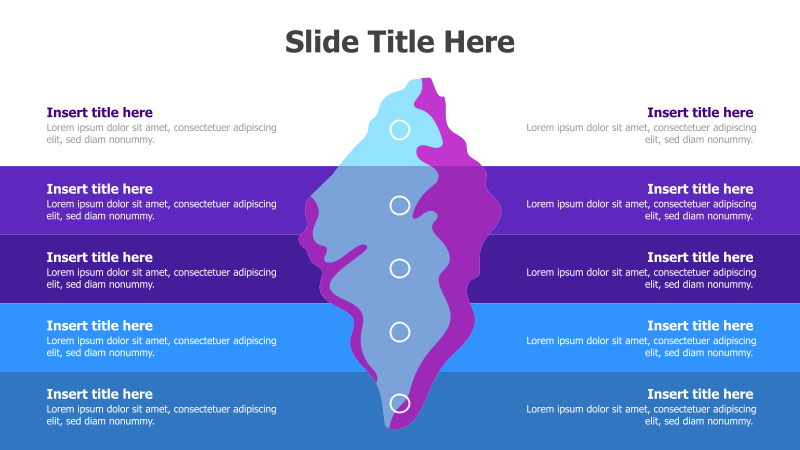
10-Point Iceberg Diagram
This template presents information using a visually striking iceberg metaphor with ten distinct points.
Layout & Structure: The template features a central iceberg shape, constructed from ten horizontally stacked, progressively smaller rectangles. Each rectangle represents a point or level, with a central vertical line running through the iceberg. Text boxes are positioned alongside each level for detailed explanations. The iceberg is angled, creating a dynamic visual flow.
Style: The design employs a modern aesthetic with a vibrant color gradient – transitioning from blues and purples to pinks. A subtle 3D effect is applied to the iceberg, enhancing its depth. The use of rounded rectangles and clean typography contributes to a professional and engaging look.
Use Cases:
- Illustrating the core components of a strategy.
- Presenting the layers of a problem or solution.
- Demonstrating the foundation of a business model.
- Visualizing the stages of a project.
- Highlighting key factors influencing a decision.
Key Features:
- Visually compelling iceberg metaphor.
- Clear and organized ten-point structure.
- Fully customizable colors and text.
- Modern and professional design.
- Effective for showcasing hierarchical relationships.
Tags:
Ready to Get Started?
Impress your audience and streamline your workflow with GraphiSlides!
Install Free Add-onNo credit card required for free plan.