Fishbone Diagram Template
This template provides a visual framework for identifying potential causes of a problem, often referred to as a root cause analysis. It's designed to help teams brainstorm and organize factors contributing to an issue.
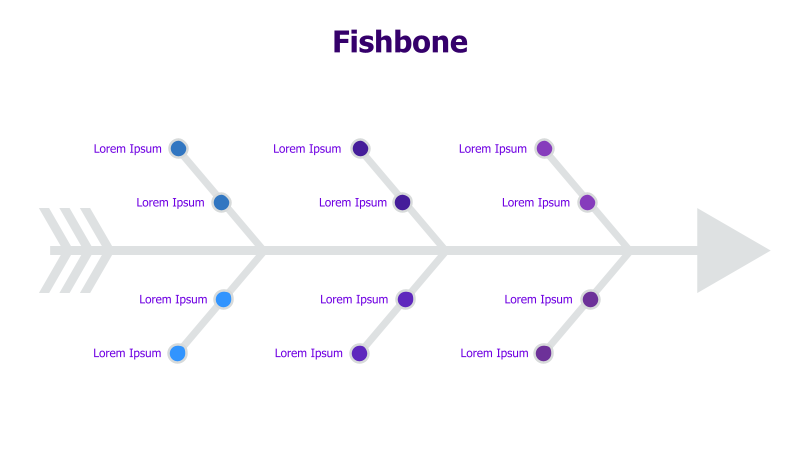
Layout & Structure: The template features a classic fishbone diagram layout, also known as an Ishikawa diagram. A central horizontal line represents the problem statement, while angled lines branching off represent major categories of potential causes. Each category then has sub-branches for more specific factors. This particular template has three main branches, each with three sub-branches, creating a 3-level structure.
Style: The diagram utilizes a clean and modern aesthetic with a purple and gray color scheme. The lines are simple and direct, promoting clarity. The use of circular nodes for each cause helps to visually organize the information. The overall style is professional and suitable for business presentations.
Use Cases:
- Root cause analysis for product defects
- Identifying factors contributing to project delays
- Analyzing reasons for customer dissatisfaction
- Troubleshooting operational issues
- Problem-solving in quality control
Key Features:
- Clear visual representation of cause-and-effect relationships
- Easy to customize with specific problem statements and causes
- Promotes collaborative brainstorming
- Helps to identify the most significant contributing factors
- Fully editable and adaptable to various problem scenarios
Tags:
Ready to Get Started?
Impress your audience and streamline your workflow with GraphiSlides!
Install Free Add-onNo credit card required for free plan.