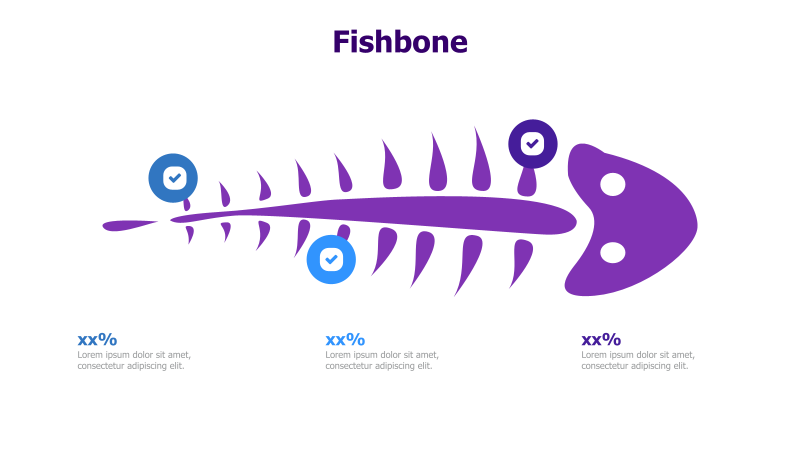
Fishbone Diagram with Percentage Breakdown
This template presents a fishbone diagram, ideal for root cause analysis or problem-solving.
Layout & Structure: The slide features a fishbone shape with a central spine and multiple angled 'bones' extending from it. Three bones are highlighted with checkmarks and percentage placeholders. The diagram is designed to visually represent contributing factors to a central issue.
Style: The template employs a modern, flat design with a purple and blue color scheme. The use of rounded shapes and a clean aesthetic creates a professional and approachable look.
Use Cases:
- Root cause analysis
- Problem-solving sessions
- Identifying contributing factors to a specific issue
- Process improvement initiatives
- Quality control analysis
Key Features:
- Visually appealing fishbone design
- Clear representation of cause-and-effect relationships
- Customizable percentage breakdowns
- Easy to understand and present
- Modern and professional aesthetic
Tags:
fishbonediagramroot cause analysisproblem solvingcause and effectprocess improvementpercentagepurplebluemodernflat design
Ready to Get Started?
Impress your audience and streamline your workflow with GraphiSlides!
Install Free Add-onNo credit card required for free plan.