Colored Circular Charts and Indicator Dashboard
This template presents a clean and modern dashboard layout utilizing circular progress charts and a linear indicator. It's ideal for showcasing key metrics and progress updates.
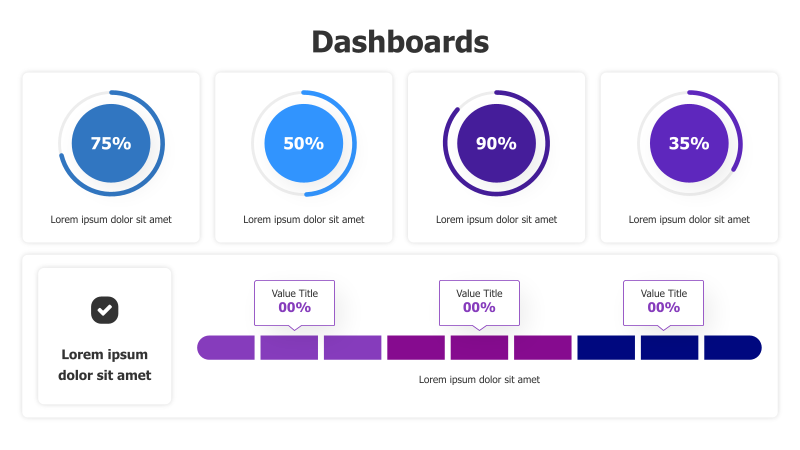
Layout & Structure: The template features four circular charts arranged in a row, each displaying a percentage value. Below these, a section includes a checkmark icon paired with text, followed by three linear indicators with percentage values. The layout is designed for clear data visualization and quick comprehension.
Style: The design employs a vibrant color palette of blues and purples, creating a visually appealing and modern aesthetic. The circular charts have a ring-like appearance with a gradient effect. The overall style is professional and suitable for a variety of business presentations.
Use Cases:
- Project progress tracking
- Key performance indicator (KPI) dashboards
- Goal achievement visualization
- Status reports
- Performance reviews
Key Features:
- Visually engaging circular charts
- Clear percentage displays
- Modern color scheme
- Easy-to-understand indicators
- Fully customizable elements
Tags:
Ready to Get Started?
Impress your audience and streamline your workflow with GraphiSlides!
Install Free Add-onNo credit card required for free plan.