4-Level Editable Meter Chart with Percentages
This template features a visually engaging meter chart design to represent progress, completion rates, or levels of achievement.
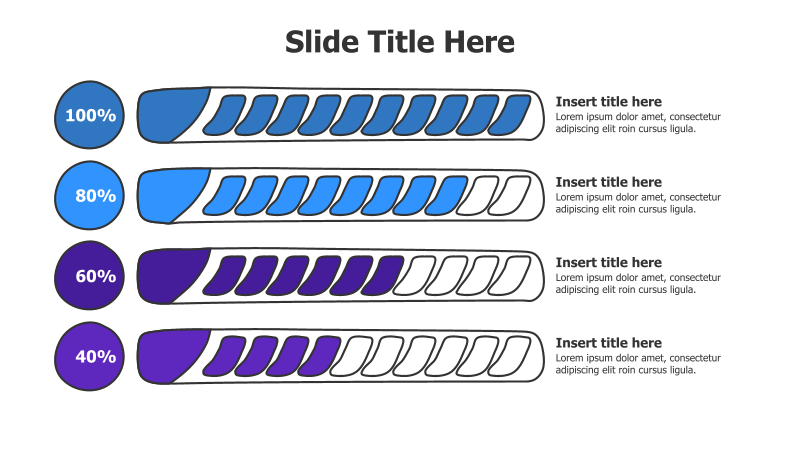
Layout & Structure: The slide showcases four horizontal meter charts, each divided into ten segments. Each chart is accompanied by a circular label displaying a percentage (100%, 80%, 60%, 40%). To the right of each meter, there's a placeholder for a title and descriptive text.
Style: The design employs a modern aesthetic with a 3D effect on the meter segments, creating depth and visual interest. A gradient color scheme is used, transitioning from blue to purple as the percentage decreases. The overall look is clean and professional.
Use Cases:
- Presenting project completion status.
- Illustrating performance metrics across different teams or departments.
- Demonstrating progress towards goals and objectives.
- Visualizing survey results or customer satisfaction levels.
- Showing levels of expertise or skill.
Key Features:
- Fully editable percentages and text.
- Clear visual representation of progress.
- Engaging 3D meter design.
- Easy-to-understand percentage indicators.
- Professional and modern aesthetic.
Tags:
Ready to Get Started?
Impress your audience and streamline your workflow with GraphiSlides!
Install Free Add-onNo credit card required for free plan.