4 Points Editable Curved Colored Stripes with Percentage Infographic
This template features a clean and modern design for presenting comparative data or progress updates.
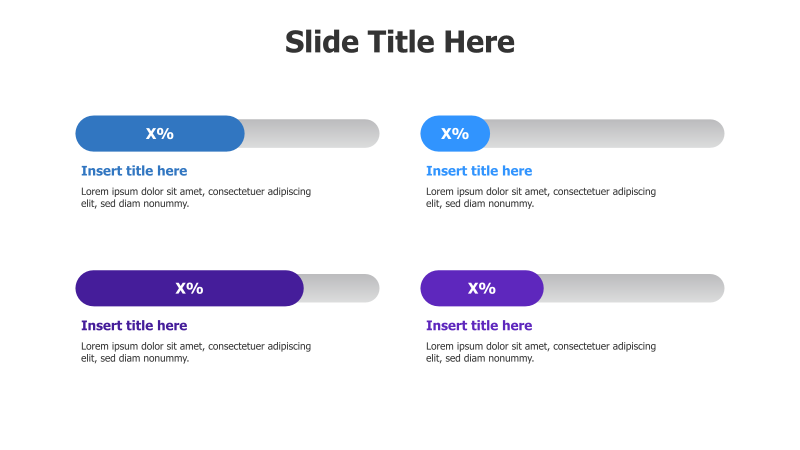
Layout & Structure: The slide is divided into four distinct sections, each containing a curved colored stripe representing a percentage value. Each section includes a placeholder for a title and descriptive text. The stripes are arranged in a 2x2 grid.
Style: The template utilizes a flat design with subtle gradients and rounded corners, creating a professional and approachable aesthetic. The color palette consists of blue, gray, purple, and a lighter shade of gray for the background. The use of color helps to visually differentiate each section.
Use Cases:
- Presenting market share data.
- Illustrating project completion percentages.
- Comparing performance metrics across different departments.
- Showcasing survey results or customer feedback.
- Highlighting key statistics or achievements.
Key Features:
- Fully editable colors and text.
- Clear visual representation of percentages.
- Modern and professional design.
- Easy to understand and interpret.
Tags:
Ready to Get Started?
Impress your audience and streamline your workflow with GraphiSlides!
Install Free Add-onNo credit card required for free plan.