4-Point Editable Colored Circles with Percentage Infographic
This template presents information using four stacked, circular segments, each representing a distinct point or category.
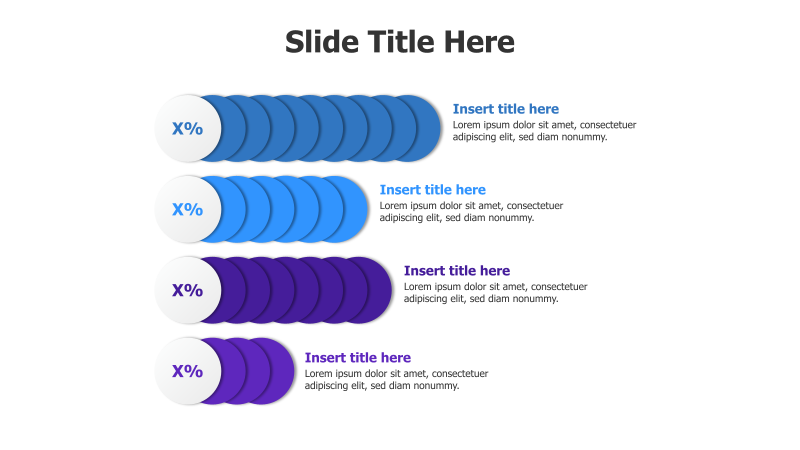
Layout & Structure: The slide features four horizontally aligned, semi-circular shapes stacked on top of each other. Each segment is divided into smaller circular units, visually representing a percentage or proportion. A text box is positioned to the right of each segment for detailed descriptions. The arrangement creates a clear, hierarchical flow from top to bottom.
Style: The template employs a modern aesthetic with a 3D effect achieved through subtle shading and color gradients. The use of bright, contrasting colors (blue and purple) enhances visual appeal and differentiation between segments. The overall design is clean and professional.
Use Cases:
- Presenting market share distribution.
- Illustrating the breakdown of project tasks.
- Showing the percentage contribution of different departments to overall revenue.
- Visualizing survey results or customer feedback.
- Demonstrating the stages of a process with associated completion percentages.
Key Features:
- Fully editable shapes and text.
- Clear visual representation of proportions.
- Engaging 3D effect for enhanced impact.
- Customizable colors and percentages.
- Suitable for a wide range of data visualization needs.
Tags:
Ready to Get Started?
Impress your audience and streamline your workflow with GraphiSlides!
Install Free Add-onNo credit card required for free plan.