Cause and Multiple Effects Diagram
This template visually represents a cause-and-effect relationship with a single cause branching out into multiple effects.
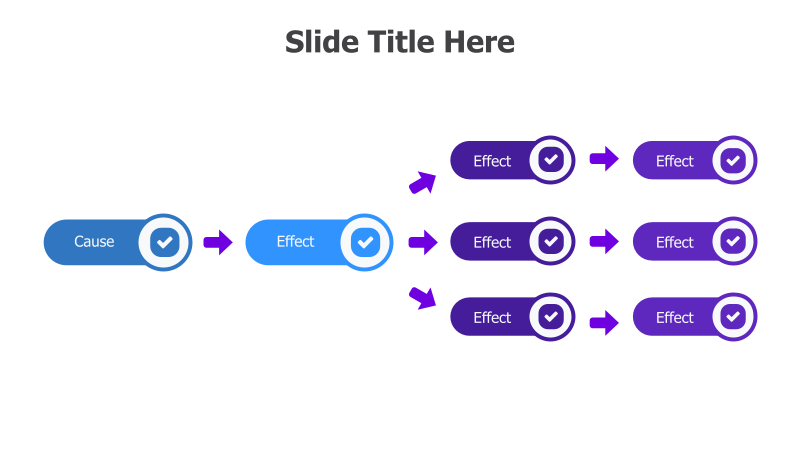
Layout & Structure: The diagram features a linear flow starting with a "Cause" node, which then branches into three separate paths, each leading through an "Effect" node and then to a final "Effect" node. The structure emphasizes how a single initial event can lead to various outcomes. It has a total of 7 nodes.
Style: The template utilizes a clean, modern aesthetic with a light background and contrasting purple and blue color scheme. The nodes are circular with checkmarks inside, and arrows indicate the direction of the flow. The design is simple and professional.
Use Cases:
- Analyzing the consequences of a decision.
- Illustrating the ripple effect of a policy change.
- Demonstrating the various outcomes of a marketing campaign.
- Explaining the impact of a specific event on different areas of a business.
- Presenting the potential results of a research finding.
Key Features:
- Clear and concise visual representation.
- Easy to understand flow.
- Fully customizable colors and text.
- Suitable for a wide range of topics.
Tags:
Ready to Get Started?
Impress your audience and streamline your workflow with GraphiSlides!
Install Free Add-onNo credit card required for free plan.