Fishbone Diagram Template
This template provides a visual framework for conducting root cause analysis, often referred to as a Fishbone or Ishikawa diagram.
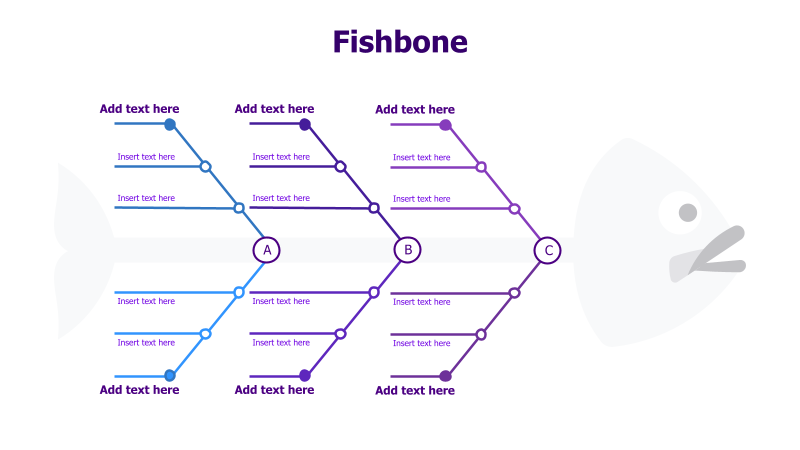
Layout & Structure: The template features a central spine representing the problem, with branches extending outwards to categorize potential causes. It includes three main branches, each with two levels of sub-branches. Each branch has placeholders for text input, allowing for detailed exploration of contributing factors. The diagram is designed to visually map out the relationship between causes and effects.
Style: The design employs a clean, modern aesthetic with a light purple and blue color scheme. The use of rounded edges and a subtle gradient effect creates a professional and approachable look. A stylized fish graphic is included as a visual element.
Use Cases:
- Identifying the root causes of a problem or issue.
- Brainstorming potential solutions.
- Analyzing process failures.
- Improving quality control.
- Troubleshooting technical difficulties.
Key Features:
- Clear and organized layout.
- Fully customizable text boxes.
- Visually appealing design.
- Effective for collaborative problem-solving.
- Easy to understand and present.
Tags:
Ready to Get Started?
Impress your audience and streamline your workflow with GraphiSlides!
Install Free Add-onNo credit card required for free plan.