2-Point Circular Comparison Infographic
This template presents a clear visual comparison between two distinct points or concepts.
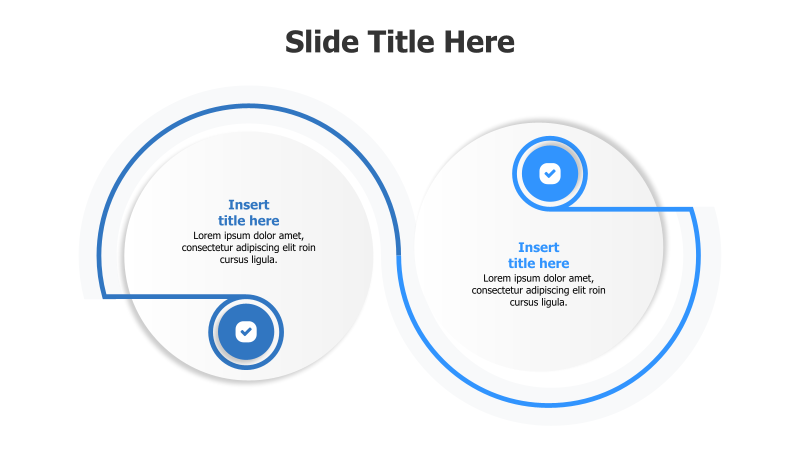
Layout & Structure: The template features two large, interconnected circles. Each circle represents a single point and contains a title area and a descriptive text section. A curved line visually connects the two circles, suggesting a relationship or flow between them. Each circle also contains a checkmark icon.
Style: The design employs a modern aesthetic with a light gray background and a vibrant blue accent color for the circles and connecting line. Subtle shadows are used to create a slight 3D effect, enhancing visual depth. The overall style is clean and professional.
Use Cases:
- Comparing two product features.
- Highlighting the pros and cons of two options.
- Illustrating two different approaches to a problem.
- Presenting before-and-after scenarios.
- Showcasing two stages in a process.
Key Features:
- Simple and easy-to-understand layout.
- Visually appealing design.
- Fully customizable text and colors.
- Clear visual distinction between the two points.
- Suitable for a variety of business and educational presentations.
Tags:
Ready to Get Started?
Impress your audience and streamline your workflow with GraphiSlides!
Install Free Add-onNo credit card required for free plan.