4-Point Editable Divided Pie Chart Infographic
This template presents information using four proportionally divided pie charts, ideal for showcasing progress, percentages, or component breakdowns.
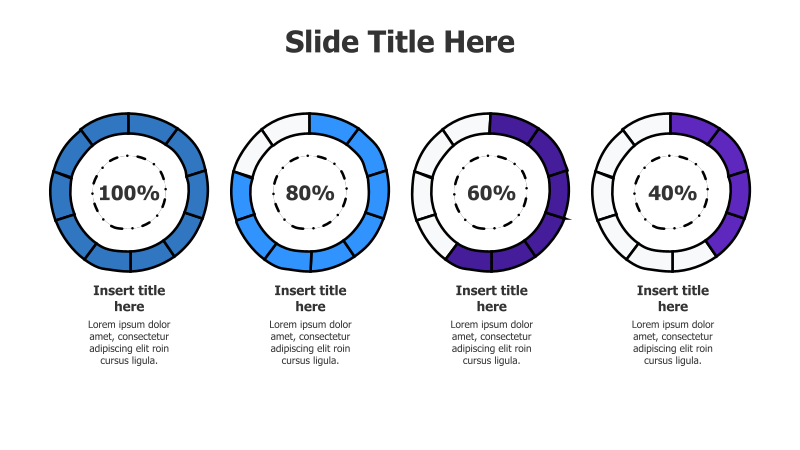
Layout & Structure: The template features four circular pie charts arranged horizontally. Each chart is divided into sections representing percentages (100%, 80%, 60%, and 40%). Below each chart is a placeholder for a title and descriptive text.
Style: The design incorporates a modern aesthetic with a gradient color scheme transitioning from blue to purple. Each pie chart has a subtle 3D effect with a shadow, enhancing visual appeal. The use of bold numbers within the charts ensures clarity.
Use Cases:
- Presenting project completion stages.
- Illustrating market share distribution.
- Showing the breakdown of a budget.
- Visualizing survey results or data percentages.
- Demonstrating the composition of a whole.
Key Features:
- Fully editable shapes and text.
- Clear visual representation of proportions.
- Engaging color gradient and 3D effect.
- Versatile for various data presentation scenarios.
- Easy to understand and interpret.
Tags:
Ready to Get Started?
Impress your audience and streamline your workflow with GraphiSlides!
Install Free Add-onNo credit card required for free plan.