4-Point Comparison with Descriptions
This template presents a four-point comparison, combining bar charts with descriptive text boxes. It's ideal for showcasing relative values and providing supporting details.
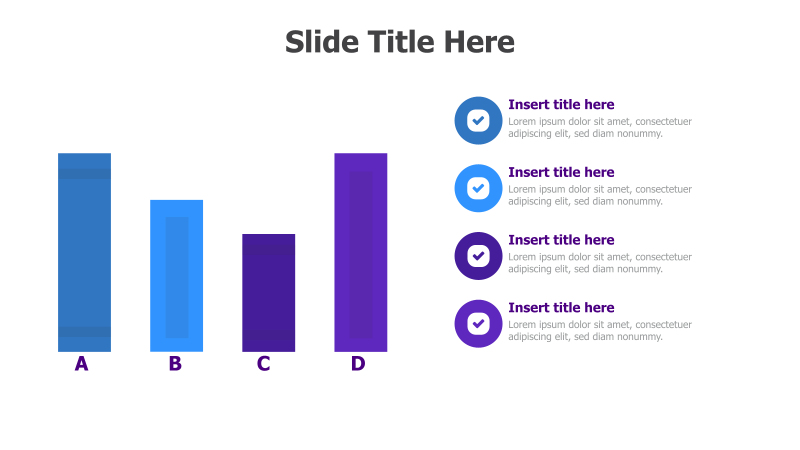
Layout & Structure: The slide features four vertical bar charts (A, B, C, and D) arranged horizontally. Each bar represents a different point or category. To the right of the bars are four circular text boxes, each aligned with its corresponding bar, providing space for detailed explanations or descriptions.
Style: The template utilizes a clean and modern aesthetic with a light blue and purple color scheme. The bars have a subtle gradient effect, and the circular text boxes include a checkmark icon for emphasis. The overall design is professional and visually appealing.
Use Cases:
- Comparing product features.
- Presenting different options or alternatives.
- Highlighting key performance indicators (KPIs).
- Analyzing survey results or data points.
- Showcasing the strengths and weaknesses of different strategies.
Key Features:
- Clear visual comparison.
- Space for detailed explanations.
- Modern and professional design.
- Fully customizable colors and text.
- Easy-to-understand data representation.
Tags:
Ready to Get Started?
Impress your audience and streamline your workflow with GraphiSlides!
Install Free Add-onNo credit card required for free plan.