Performance Meter Graphic
This slide features a visually engaging performance meter graphic, ideal for showcasing progress, KPIs, or evaluation results.
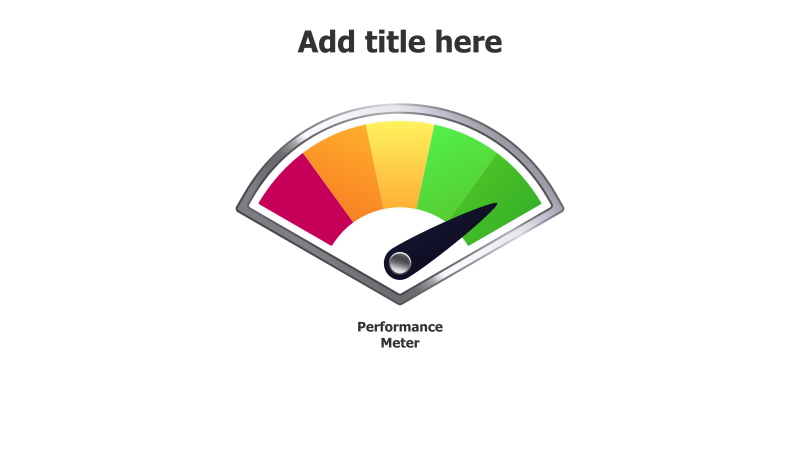
Layout & Structure: The template centers around a semi-circular gauge with five distinct color-coded sections (red, yellow, green). A black pointer indicates the current performance level. The graphic is positioned below a title placeholder and above a descriptive label.
Style: The design employs a clean, modern aesthetic with subtle gradients and shadows to create a sense of depth. The color scheme is intuitive, using red to signify poor performance, yellow for moderate, and green for excellent. The overall look is professional and easily understandable.
Use Cases:
- Presenting key performance indicators (KPIs).
- Visualizing project status and progress.
- Evaluating employee or team performance.
- Illustrating risk assessment levels.
- Demonstrating the effectiveness of a strategy.
Key Features:
- Clear and concise visual representation.
- Intuitive color-coding for easy interpretation.
- Fully customizable pointer position.
- Professional and modern design.
- Suitable for a wide range of business presentations.
Tags:
Ready to Get Started?
Impress your audience and streamline your workflow with GraphiSlides!
Install Free Add-onNo credit card required for free plan.